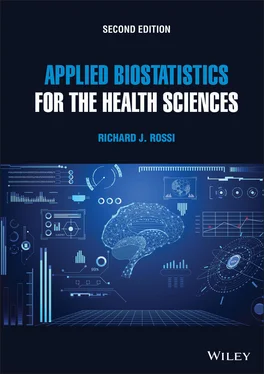
Richard J. Rossi - Applied Biostatistics for the Health Sciences
Здесь есть возможность читать онлайн «Richard J. Rossi - Applied Biostatistics for the Health Sciences» — ознакомительный отрывок электронной книги совершенно бесплатно, а после прочтения отрывка купить полную версию. В некоторых случаях можно слушать аудио, скачать через торрент в формате fb2 и присутствует краткое содержание. Жанр: unrecognised, на английском языке. Описание произведения, (предисловие) а так же отзывы посетителей доступны на портале библиотеки ЛибКат.
- Название:Applied Biostatistics for the Health Sciences
- Автор:
- Жанр:
- Год:неизвестен
- ISBN:нет данных
- Рейтинг книги:3 / 5. Голосов: 1
-
Избранное:Добавить в избранное
- Отзывы:
-
Ваша оценка:
- 60
- 1
- 2
- 3
- 4
- 5
Applied Biostatistics for the Health Sciences: краткое содержание, описание и аннотация
Предлагаем к чтению аннотацию, описание, краткое содержание или предисловие (зависит от того, что написал сам автор книги «Applied Biostatistics for the Health Sciences»). Если вы не нашли необходимую информацию о книге — напишите в комментариях, мы постараемся отыскать её.
APPLIED BIOSTATISTICS FOR THE HEALTH SCIENCES Applied Biostatistics for the Health Sciences
Applied Biostatistics for the Health Sciences
Applied Biostatistics for the Health Sciences — читать онлайн ознакомительный отрывок
Ниже представлен текст книги, разбитый по страницам. Система сохранения места последней прочитанной страницы, позволяет с удобством читать онлайн бесплатно книгу «Applied Biostatistics for the Health Sciences», без необходимости каждый раз заново искать на чём Вы остановились. Поставьте закладку, и сможете в любой момент перейти на страницу, на которой закончили чтение.
Интервал:
Закладка:
3 Chapter 5Figure 5.1 A plot of the exponential...Figure 5.2 Histograms of the sample means...Figure 5.3 A plot showing the difference...Figure 5.4 t distributions with ν = 5...Figure 5.5 The sampling distributions of the...Figure 5.6 Histogram and normal probability plot...
4 Chapter 6Figure 6.1 The 95% confidence interval...Figure 6.2 Normal probability plot for the...Figure 6.3 Normal probability plots for Exercise...Figure 6.4 Normal probability plot for bootstrapped...
5 Chapter 7Figure 7.1 The power curve for a...Figure 7.2 The power curves for a...Figure 7.3 The area representing the p -value...Figure 7.4 The p -value for...Figure 7.5 The MINITAB output for testing...Figure 7.6 A normal probability plot for...Figure 7.7 A normal probability plot of...Figure 7.8 The MINITAB output for the...Figure 7.9 Normal probability plots for the...Figure 7.10 The MINITAB output for the...Figure 7.11 Normal probability plot for a...Figure 7.12 Normal probability plot for...
6 Chapter 8Figure 8.1 A scatterplot of percent body...Figure 8.2 Examples of the common shapes...Figure 8.3 Scatterplots of body density versus...Figure 8.4 A scatterplot of body density...Figure 8.5 Scatterplots with linear data clouds...Figure 8.6 Scatterplots with linear data clouds...Figure 8.7 Scatterplots with linear data clouds...Figure 8.8 Scatterplots with linear data clouds...Figure 8.9 A scatterplot indicating a strong...Figure 8.10 A scatterplot indicating a strong...Figure 8.11 An example illustrating the relationship...Figure 8.12 The simple linear regression model.Figure 8.13 A scatterplot of body density...Figure 8.14 The fitted line plot of...Figure 8.15 An example of a residual...Figure 8.16 Examples of residual plots with...Figure 8.17 Possible funneling shapes in a...Figure 8.18 An example of scatterplot and...Figure 8.19 An example of scatterplot and...Figure 8.20 An example of a scatterplot...Figure 8.21 The residual plot for the...Figure 8.22 A residual plot with an...Figure 8.23 An example of a normal...Figure 8.24 An example of a normal...Figure 8.25 A scatterplot of percent body...Figure 8.26 The residual plot and normal...Figure 8.27 The MINITAB ANOV table for...Figure 8.28 The MINITAB output for the...Figure 8.29 The MINITAB output for the...Figure 8.30 The MINITAB output for estimating...Figure 8.31 The MINITAB output for estimating...Figure 8.32 The MINITAB output for estimating...Figure 8.33 A scatterplot of percent body...Figure 8.34 Scatterplots for Exercise 8.6.Figure 8.35 Normal probability plots for Exercise...Figure 8.36 Residual plots for Exercise 8.43Figure 8.37 MINITAB output for the model...Figure 8.38 MINITAB output for the model...Figure 8.39 MINITAB output for modeling Hip...Figure 8.40 MINITAB output for modeling Abdomen...Figure 8.41 MINITAB output for modeling BMI...Figure 8.42 Fitted line plot for weight...Figure 8.43 Histogram of the bootstrap sampling...
7 Chapter 9Figure 9.1 Scatterplots of Y versus X 1...Figure 9.2 A three-dimensional scatterplot...Figure 9.3 A scatterplot of the response...Figure 9.4 The residual plot for the...Figure 9.5 Residual plot for the log...Figure 9.6 Residual plot for the multiple...Figure 9.7 Fitted line plot for the...Figure 9.8 The normal probability plot for...Figure 9.9 The normal plot for the...Figure 9.10 The residual plot for the...Figure 9.11 The MINITAB summary of the...Figure 9.12 The no-interaction dummy...Figure 9.13 The interaction dummy variable regression...Figure 9.14 Normal probability plot for the...Figure 9.15 Residual plot for Exercise 9.37.
8 Chapter 10Figure 10.1 Logistic curves for...Figure 10.2 Plot of the estimated probability...Figure 10.3 A plot of the standardized...Figure 10.4 A plot of the...Figure 10.5 A plot of the...Figure 10.6 Plots of the estimated probability...Figure 10.7 Plot of the standardized Pearson...Figure 10.8 Plots of ... against observation...Figure 10.9 The MINITAB output for the...Figure 10.10 MINITAB output for the interaction...Figure 10.11 The MINITAB output for Exercise...Figure 10.12 The MINITAB output for Exercise...Figure 10.13 Plot of the Pearson residuals...Figure 10.14 MINITAB output for the logistic...Figure 10.15 MINITAB output for the logistic...Figure 10.16 The MINITAB output for Exercise...Figure 10.17 The MINITAB output for Exercise...Figure 10.18 The MINITAB output for the...Figure 10.19 The MINITAB output for the...Figure 10.20 The MINITAB output for the...Figure 10.21 The MINITAB output for the...
9 Chapter 12Figure 12.1 MINITAB output for Levene’s...Figure 12.2 Normal probability plot for the...Figure 12.3 The MINITAB output for the...Figure 12.4 Normal probability plot of the...Figure 12.5 Levene’s test of constant...Figure 12.6 The MINITAB output for the...Figure 12.7 The normal probability plot and...Figure 12.8 The MINITAB output for determining...Figure 12.9 Normal probability plot for Exercise...Figure 12.10 Summary of Levene’s test...Figure 12.11 Summary of Levene’s test...
10 Chapter 13Figure 13.1 The typical shape of a...Figure 13.2 Plot of the Kaplan–Meier...Figure 13.3 Kaplan–Meier estimates of the...Figure 13.4 Kaplan–Meier estimate of the...Figure 13.5 Kaplan–Meier estimates of the...Figure 13.6 Kaplan–Meier estimates of the...Figure 13.7 Kaplan–Meier estimates of the...
List of Tables
1 Chapter 1 Table 1.1 A Description of the Variables... Table 1.2 A Description of the Variables... Table 1.3 A Description of the Variables... Table 1.4 A Description of the Variables... Table 1.5 A Description of the Variables... Table 1.6 A Description of the Variables... Table 1.7 A Description of the Variables... Table 1.8 A Description of the Variables... Table 1.9 A Description of the Variables...
2 Chapter 2 Table 2.1 The Distribution of Blood... Table 2.2 The Distribution of Blood... Table 2.3 The Distribution of Adults... Table 2.4 The Proportions of Blood ... Table 2.5 The Weight Classifications... Table 2.6 The Means and Standard Deviations... Table 2.7 The Distribution of Blood... Table 2.8 Summary Table for the... Table 2.9 The Percentages of Each Blood... Table 2.10 The Binomial Distribution for... Table 2.11 An Excerpted Section of the... Table 2.12 Selected Percentiles of a Standard...Table 2.13 Prevalence of Overweight Children...Table 2.14 Percentages of Americans in the Blood...Table 2.15 The Approximate Means and Standard...Table 2.16 The Sensitivity and Specificity...Table 2.17 The Binomial Probabilities...Table 2.18 The Standard Weight Classifications...Table 2.19 The Mean and Standard Deviations...
3 Chapter 3 Table 3.1 List of Volunteers from Which... Table 3.2 List of Volunteers with... Table 3.3 List of Individuals to be Sampled Table 3.4 Strata Size, Standard Deviation... Table 3.5 Strata Size and the Cost of Sampling...Table 3.6 Strata Size, Standard Deviation...Table 3.7 Strata Size and Cost of Sampling...Table 3.8 Strata Size, Standard Deviation...Table 3.9 Strata Size and Cost of Sampling...Table 3.10 Population Information on Three...Table 3.11 Population Information on Three...Table 3.12 Population Information for Registered...Table 3.13 Population Information for Public and Private....Table 3.14 Sampling Information on AMA Surgeons...
4 Chapter 4Table 4.1 The Five-Number Summary...Table 4.2 Summarized Frequencies of Cannabis...Table 4.3 Results of the Chronic Fatigue...Table 4.4 An Example of a...Table 4.5 A ... Contingency...Table 4.6 A ... Contingency...Table 4.7 Result of the 120 Individuals...Table 4.8 A ... Contingency...Table 4.9 A ... Contingency...Table 4.10 Summary Counts for Example 4.17Table 4.11 Summary Counts for Example 4.17Table 4.12 Estimates of Selected Birth...Table 4.13 Values of a Sample of...Table 4.14 The Number of Sampled...Table 4.15 Summary Statistics for....Table 4.16 Summary Statistics for...Table 4.17 A Random Sample of Heights...Table 4.18 Summary Statistics for...Table 4.19 A Frequency Table Based...Table 4.20 The Five-Number Summary...Table 4.21 Frequency Table for the Age...Table 4.22 The Results of a Diagnostic...Table 4.23 Summary Statistics for the...Table 4.24 Summary Statistics for...Table 4.25 Summary Statistics for...Table 4.26 The Number of False Positives...Table 4.27 Results of a Study on a New...Table 4.28 A Summary of the Number...
Читать дальшеИнтервал:
Закладка:
Похожие книги на «Applied Biostatistics for the Health Sciences»
Представляем Вашему вниманию похожие книги на «Applied Biostatistics for the Health Sciences» списком для выбора. Мы отобрали схожую по названию и смыслу литературу в надежде предоставить читателям больше вариантов отыскать новые, интересные, ещё непрочитанные произведения.
Обсуждение, отзывы о книге «Applied Biostatistics for the Health Sciences» и просто собственные мнения читателей. Оставьте ваши комментарии, напишите, что Вы думаете о произведении, его смысле или главных героях. Укажите что конкретно понравилось, а что нет, и почему Вы так считаете.


