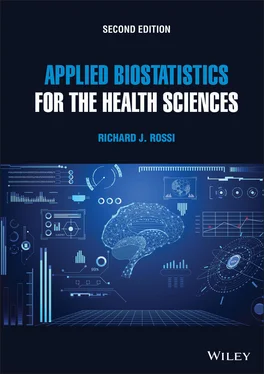
Richard J. Rossi - Applied Biostatistics for the Health Sciences
Здесь есть возможность читать онлайн «Richard J. Rossi - Applied Biostatistics for the Health Sciences» — ознакомительный отрывок электронной книги совершенно бесплатно, а после прочтения отрывка купить полную версию. В некоторых случаях можно слушать аудио, скачать через торрент в формате fb2 и присутствует краткое содержание. Жанр: unrecognised, на английском языке. Описание произведения, (предисловие) а так же отзывы посетителей доступны на портале библиотеки ЛибКат.
- Название:Applied Biostatistics for the Health Sciences
- Автор:
- Жанр:
- Год:неизвестен
- ISBN:нет данных
- Рейтинг книги:3 / 5. Голосов: 1
-
Избранное:Добавить в избранное
- Отзывы:
-
Ваша оценка:
- 60
- 1
- 2
- 3
- 4
- 5
Applied Biostatistics for the Health Sciences: краткое содержание, описание и аннотация
Предлагаем к чтению аннотацию, описание, краткое содержание или предисловие (зависит от того, что написал сам автор книги «Applied Biostatistics for the Health Sciences»). Если вы не нашли необходимую информацию о книге — напишите в комментариях, мы постараемся отыскать её.
APPLIED BIOSTATISTICS FOR THE HEALTH SCIENCES Applied Biostatistics for the Health Sciences
Applied Biostatistics for the Health Sciences
Applied Biostatistics for the Health Sciences — читать онлайн ознакомительный отрывок
Ниже представлен текст книги, разбитый по страницам. Система сохранения места последней прочитанной страницы, позволяет с удобством читать онлайн бесплатно книгу «Applied Biostatistics for the Health Sciences», без необходимости каждый раз заново искать на чём Вы остановились. Поставьте закладку, и сможете в любой момент перейти на страницу, на которой закончили чтение.
Интервал:
Закладка:
10 CHAPTER 6 CONFIDENCE INTERVALS 6.1 Interval Estimation6.2 Confidence Intervals6.3 Single Sample Confidence Intervals6.3.1 Confidence Intervals for Proportions6.3.2 Confidence Intervals for a Mean6.3.3 Large Sample Confidence Intervals for μ 6.3.4 Small Sample Confidence Intervals for μ 6.3.5 Determining the Sample Size for a Confidence Interval for the Mean6.4 Bootstrap Confidence Intervals6.5 Two Sample Comparative Confidence Intervals6.5.1 Confidence Intervals for Comparing Two Proportions6.5.2 Confidence Intervals for the Relative Risk6.5.3 Confidence Intervals for the Odds RatioGlossaryExercises
11 CHAPTER 7 TESTING STATISTICAL HYPOTHESES 7.1 Hypothesis Testing7.1.1 The Components of a Hypothesis Test7.1.2 P-Values and Significance Testing7.2 Testing Hypotheses about Proportions7.2.1 Single Sample Tests of a Population Proportion7.2.2 Comparing Two Population Proportions7.2.3 Tests of Independence7.3 Testing Hypotheses About Means7.3.1 t -Tests7.3.2 t -Tests for the Mean of a Population7.3.3 Paired Comparison t -Tests7.3.4 Two Independent Sample t -Tests7.4 7.4 Some Final Comments on Hypothesis TestingGlossaryExercises
12 CHAPTER 8 SIMPLE LINEAR REGRESSION 8.1 Bivariate Data, Scatterplots, and Correlation8.1.1 Scatterplots8.1.2 Correlation8.2 The Simple Linear Regression Model8.2.1 The Simple Linear Regression Model8.2.2 Assumptions of the Simple Linear Regression Model8.3 Fitting a Simple Linear Regression Model8.4 Assessing the Assumptions and Fit of a Simple Linear Regression Model8.4.1 Residuals8.4.2 Residual Diagnostics8.4.3 Estimating σ and Assessing the Strength of the Linear Relationship8.5 Statistical Inferences based on a Fitted Model8.5.1 Inferences About β 08.5.2 Inferences About β 18.6 Inferences about the Response Variable8.6.1 Inferences About μ Y|X8.6.2 Inferences for Predicting Values of Y 8.7 Model Validation8.7.1 Selecting the Training and Validation Data Sets8.7.2 Validating a Fitted Model8.8 Some Final Comments on Simple Linear RegressionGlossaryExercises
13 CHAPTER 9 MULTIPLE REGRESSION 9.1 Investigating Multivariate Relationships9.2 The Multiple Linear Regression Model9.2.1 The Assumptions of a Multiple Regression Model9.3 Fitting a Multiple Linear Regression Model9.4 Assessing the Assumptions of a Multiple Linear Regression Model9.4.1 Residual Diagnostics9.4.2 Detecting Multivariate Outliers and Influential Observations9.5 Assessing the Adequacy of Fit of a Multiple Regression Model9.5.1 Estimating σ 9.5.2 The Coefficient of Determination9.5.3 Multiple Regression Analysis of Variance9.6 Statistical Inferences-Based Multiple Regression Model9.6.1 Inferences about the Regression Coefficients9.6.2 Inferences About the Response Variable9.7 Comparing Multiple Regression Models9.8 Multiple Regression Models with Categorical Variables9.8.1 Regression Models with Dummy Variables9.8.2 Testing the Importance of Categorical Variables9.9 Variable Selection Techniques9.9.1 Model Selection Using Maximum R 2 adj9.9.2 Model Selection using BIC9.10 Model Validation9.10.1 Selecting the Training and Validation Data Sets9.10.2 Validating a Fitted Model9.11 Some Final Comments on Multiple RegressionGlossaryExercises
14 CHAPTER 10 LOGISTIC REGRESSION 10.1 The Logistic Regression Model10.1.1 Assumptions of the Logistic Regression Model10.2 Fitting a Logistic Regression Model10.3 Assessing the Fit of a Logistic Regression Model10.3.1 Checking the Assumptions of a Logistic Regression Model10.3.2 Testing for the Goodness of Fit of a Logistic Regression Model10.3.3 Model Diagnostics10.4 Statistical Inferences Based on a Logistic Regression Model10.4.1 Inferences about the Logistic Regression Coefficients10.4.2 Comparing Models10.5 Variable Selection10.6 Classification with Logistic Regression10.6.1 The Logistic Classifier10.6.2 Misclassification Errors10.7 Some Final Comments on Logistic RegressionGlossaryExercises
15 CHAPTER 11 DESIGN OF EXPERIMENTS 11.1 Experiments Versus Observational Studies11.2 The Basic Principles of Experimental Design11.2.1 Terminology11.2.2 Designing an Experiment11.3 Experimental Designs11.3.1 The Completely Randomized Design11.3.2 The Randomized Block Design11.4 Factorial Experiments11.4.1 Two-Factor Experiments11.4.2 Three-Factor Experiments11.5 Models for Designed Experiments11.5.1 The Model for a Completely Randomized Design11.5.2 The Model for a Randomized Block Design11.5.3 Models for Experimental Designs with a Factorial Treatment Structure11.6 Some Final Comments of Designed ExperimentsGlossaryExercises
16 CHAPTER 12 ANALYSIS OF VARIANCE 12.1 Single-Factor Analysis of Variance12.1.1 Partitioning the Total Experimental Variation12.1.2 The Model Assumptions12.1.3 The F -test12.1.4 Comparing Treatment Means12.2 Randomized Block Analysis of Variance12.2.1 The ANOV Table for the Randomized Block Design12.2.2 The Model Assumptions12.2.3 The F -test12.2.4 Separating the Treatment Means12.3 Multi factor Analysis of Variance12.3.1 Two-Factor Analysis of Variance12.3.2 Three-Factor Analysis of Variance12.4 Selecting the Number of Replicates in Analysis of Variance12.4.1 Determining the Number of Replicates from the Power12.4.2 Determining the Number of Replicates from D 12.5 Some Final Comments on Analysis of VarianceGlossaryExercises
17 CHAPTER 13 SURVIVAL ANALYSIS 13.1 The Kaplan–Meier Estimate of the Survival Function13.2 The Proportional Hazards Model13.3 Logistic Regression and Survival Analysis13.4 Some Final Comments on Survival AnalysisGlossaryExercises
18 REFERENCES
19 APPENDIX A
20 PROBLEM SOLUTIONS
21 INDEX
22 End User License Agreement
List of Illustrations
1 Chapter 2Figure 2.1 Different types of classifications...Figure 2.2 Weight-by-age chart for girls in the NHANES study.Figure 2.3 A bar chart of the...Figure 2.4 A bar chart of the...Figure 2.5 An example of a mound-shaped distribution.Figure 2.6 An example of a distribution...Figure 2.7 An example of a distribution...Figure 2.8 An example of a bimodal...Figure 2.9 Distribution of age at which...Figure 2.10 Distribution of the age at...Figure 2.11 Distribution of family size according...Figure 2.12 The relationships between...Figure 2.13 The relationships between...Figure 2.14 The distribution of the age...Figure 2.15 The distributions of the age...Figure 2.16 Two different populations having the...Figure 2.17 IQR is the distance between...Figure 2.18 The one-standard deviation empirical...Figure 2.19 The two-standard deviation empirical...Figure 2.20 The three-standard deviation empirical...Figure 2.21 The joint distribution of blood...Figure 2.22 The distribution weight for the...Figure 2.23 A density plot for a...
2 Chapter 4Figure 4.1 Bar chart for the weight...Figure 4.2 A horizontal bar chart for...Figure 4.3 An example of a side-by-side bar chart.Figure 4.4 An example of a stacked...Figure 4.5 A bar chart for mother’s smoking...Figure 4.6 Pie chart showing the leading...Figure 4.7 An example of a simple...Figure 4.8 A simple boxplot with the...Figure 4.9 An example of an outlier...Figure 4.10 A boxplot for mother’s age...Figure 4.11 Boxplots for the birth weights...Figure 4.12 Boxplots of the serum Fas...Figure 4.13 Example of a histogram.Figure 4.14 Examples of a mound-shaped histogram...Figure 4.15 A relative frequency histogram for...Figure 4.16 An example of an unadjusted...Figure 4.17 An example of a density...Figure 4.18 A density histogram.Figure 4.19 Boxplots of birth weight by...Figure 4.20 Histograms of birth weight by...Figure 4.21 A normal probability plot of...Figure 4.22 A normal plot that passes...Figure 4.23 Normal plots for four different...Figure 4.24 Normal plots for birth weight...Figure 4.25 The four most common distributional...Figure 4.26 Histogram for percent body fat...Figure 4.27 The balancing points of three...Figure 4.28 The histogram and boxplot for...Figure 4.29 Two mound-shaped distributions...Figure 4.30 A boxplot of the percentage...Figure 4.31 A boxplot and histogram of...Figure 4.32 A normal plot of body...Figure 4.33 A histogram of body density...Figure 4.34 Scatterplot for weight versus height...Figure 4.35 Examples of the four types...Figure 4.36 An example of a strong...Figure 4.37 Examples of scatterplots. (a)...Figure 4.38 Scatterplots with and without an...Figure 4.39 Scatterplots of percent body fat...Figure 4.40 A scatterplot with the least...Figure 4.41 Bar chart of n = 412...Figure 4.42 Bar chart for mammography experience...Figure 4.43 Boxplots for the birth weights...Figure 4.44 Histogram of the variable Wrist...Figure 4.45 Histogram of the ages of...Figure 4.46 Percent histograms for the weight...Figure 4.47 Normal probability plots for Exercise...Figure 4.48 Normal probability plot for the...Figure 4.49 Normal probability plot for systolic...Figure 4.50 Scatterplots for Exercise 4.64.Figure 4.51 Scatterplot for Exercise 4.70.Figure 4.52 Scatterplot of Weight versus Hip...
Читать дальшеИнтервал:
Закладка:
Похожие книги на «Applied Biostatistics for the Health Sciences»
Представляем Вашему вниманию похожие книги на «Applied Biostatistics for the Health Sciences» списком для выбора. Мы отобрали схожую по названию и смыслу литературу в надежде предоставить читателям больше вариантов отыскать новые, интересные, ещё непрочитанные произведения.
Обсуждение, отзывы о книге «Applied Biostatistics for the Health Sciences» и просто собственные мнения читателей. Оставьте ваши комментарии, напишите, что Вы думаете о произведении, его смысле или главных героях. Укажите что конкретно понравилось, а что нет, и почему Вы так считаете.


