James A. Jahnke - Continuous Emission Monitoring
Здесь есть возможность читать онлайн «James A. Jahnke - Continuous Emission Monitoring» — ознакомительный отрывок электронной книги совершенно бесплатно, а после прочтения отрывка купить полную версию. В некоторых случаях можно слушать аудио, скачать через торрент в формате fb2 и присутствует краткое содержание. Жанр: unrecognised, на английском языке. Описание произведения, (предисловие) а так же отзывы посетителей доступны на портале библиотеки ЛибКат.
- Название:Continuous Emission Monitoring
- Автор:
- Жанр:
- Год:неизвестен
- ISBN:нет данных
- Рейтинг книги:4 / 5. Голосов: 1
-
Избранное:Добавить в избранное
- Отзывы:
-
Ваша оценка:
Continuous Emission Monitoring: краткое содержание, описание и аннотация
Предлагаем к чтению аннотацию, описание, краткое содержание или предисловие (зависит от того, что написал сам автор книги «Continuous Emission Monitoring»). Если вы не нашли необходимую информацию о книге — напишите в комментариях, мы постараемся отыскать её.
The new edition of the only single-volume reference on both the regulatory and technical aspects of U.S. and international continuous emission monitoring (CEM) systems Continuous Emission Monitoring
Continuous Emission Monitoring:
Continuous Emission Monitoring, Third Edition
Continuous Emission Monitoring — читать онлайн ознакомительный отрывок
Ниже представлен текст книги, разбитый по страницам. Система сохранения места последней прочитанной страницы, позволяет с удобством читать онлайн бесплатно книгу «Continuous Emission Monitoring», без необходимости каждый раз заново искать на чём Вы остановились. Поставьте закладку, и сможете в любой момент перейти на страницу, на которой закончили чтение.
Интервал:
Закладка:
CHAPTER 4 INTRODUCTION TO THE ANALYTICAL METHODS
The heart of any CEM system, whether extractive or in‐situ, consists of the analyzers. An extractive system transports and conditions the flue gas, but the analyzers perform the job of measurement. The selection or evaluation of CEM system analyzers must consider both regulatory specifications and performance characteristics. Although most analyzers are advertised as meeting or exceeding required specifications, care must be exercised in their selection because an analyzer's performance in the field can differ greatly from its performance on a laboratory bench.
CEM system analyzers must measure gases without interference from other gases. They are increasingly being required to measure accurately in low‐concentration ranges, and they must perform well often in hostile environments. Current U.S. EPA, Canadian, and International Organization for Standardization (ISO) standards for CEM system analyzers do not specify analytical techniques that are to be used (except for opacity monitors), but rather provide performance‐based specifications. Therefore, it is left to the CEM system manufacturer or the user to determine the measurement techniques that would be the most appropriate for a given application. This chapter provides a basis for the understanding of several techniques employed in commercially available CEM system analyzers.
THE PROPERTIES OF LIGHT
The majority of instruments used in CEM systems are based on principles associated with the interaction of light with matter. Opacity monitors measure the effects of light scattering and absorption; a nondispersive infrared analyzer measures the amount of light absorbed by a pollutant molecule; and a chemiluminescence analyzer senses the light emitted in a chemical reaction. One could treat the operation of CEM system analyzers as “black boxes” that give out answers, but an understanding of their operation is necessary to properly apply an analyzer for monitoring at a source. Although some techniques will work well in a given application, other techniques will have problems in the same application. Also, for proper evaluation of system performance, a knowledge of how an analyzer works is essential to understand the effects of interferences, temperature, pressure, and so on. This understanding will be developed by first reviewing some of the basic properties of light and how these properties can be applied to measure pollutant gas concentrations.
The Wave Nature of Light
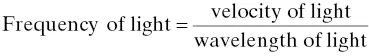
Light can be characterized as a wave composed of oscillating electric and magnetic fields. Light waves, or electromagnetic waves as they are better called, are distinguished by their wavelength or frequency. Figure 4‐1illustrates the typical sinusoidal nature of an electromagnetic wave and its associated wavelength. The length between successive oscillations of a wave is called wavelength (λ). The period of time that it takes a wave to go through an oscillation cycle is called frequency ( v ). Wavelength and frequency are related by the following expression:
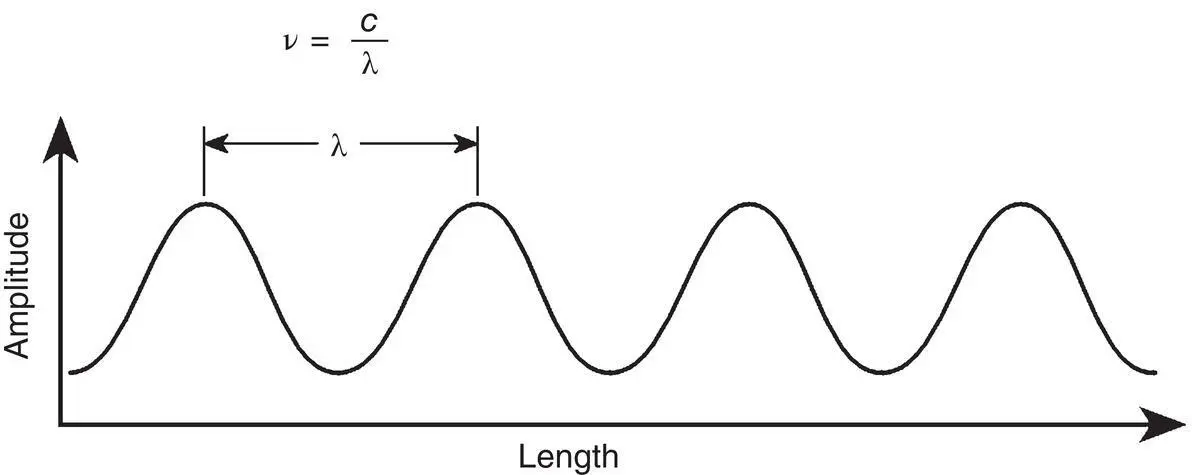
Figure 4‐1 An oscillating electric field and its wavelength.
(4‐1) 
where c is the velocity of light, 3.0 × 10 8m/s.
Literature describing continuous monitoring instruments often specifies the wavelength to characterize the spectral region used in the analytical method. Different units are often used for wavelength in different regions of the electromagnetic spectrum although the nanometer (nm) = 10 −9m has become the standard unit. Another unit, the Angstrom, Å = 10 −10m, has been used historically in the ultraviolet region. In the infrared region, both the μm = 10 −6m (also called 1 “micron”) and the wavenumber are commonly used by spectroscopists. The wavenumber is expressed as
(4‐2) 
Note that the units of  are given in terms of the number of wavelengths per centimeter, called reciprocal centimeters or wavenumbers. The wavenumber
  is essentially a measure of frequency, differing from v by the constant factor of the velocity of light. The wavenumber is calculated by calculating the reciprocal of the wavelength expressed in μm and multiply by 10 4to obtain wavenumbers in units of cm −1.
The wavelength of light used in CEM instrumentation ranges from 200 nm in the ultraviolet to 20 000 nm in the infrared. Figure 4‐2shows the regions of the electromagnetic spectrum and the wavelength bands where molecules interact with light energy. Instruments are designed to measure the effects of these interactions.
The infrared spectral region is particularly important for the measurement of gaseous pollutants, and many instruments have been designed to operate in the infrared region. The infrared region is separated into the near infrared (NIR), mid infrared (MIR), and far infrared. Although an ISO standard does exist (ISO 2015), the boundaries of these regions are not universally agreed upon; there exists some ambiguity as to where the mid infrared ends and the far infrared begins, depending upon the usage by instrument manufacturers, spectroscopists, astronomers, or others.
Absorption of Light by Molecules
Light carries energy. Light has the properties of waves, but in some of its interactions with matter it behaves as if it were composed of discrete packets of energy called photons. In a beam of light having frequency v , each of these photons carries energy defined by the Planck‐Einstein relation of Equation 4‐3.
(4‐3) 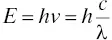
where h is Planck's constant and has a numerical value of 6.62 × 10 −27erg‐s. Clearly, the energy of a photon is dependent upon the frequency or wavelength of the light. Light (photons) of short wavelengths (such as in the ultraviolet) will carry more energy than light (photons) of longer wavelengths (such as in the infrared). Photons of different energies will have different effects. From a practical sense, sitting on the beach too long in bright sunlight can cause a severe sunburn. On the other hand, sitting under an infrared heat lamp will soothe sore muscles without causing sunburn. The effects of UV radiation are extremely severe under the Antarctic ozone hole, but less severe where the stratospheric ozone layer reduces the number of photons per unit time reaching Earth's surface. Light of different wavelengths (photons of different energies) will have a variety of effects on molecules. In a monitoring instrument, the manufacturer determines the best way to use these effects to make gas concentration measurements.
Molecules are made up of atoms and molecular electrons that are arranged in very specific patterns, which undergo unique and complex motions. If light of a given wavelength should resonate with one of these motions, it will have a high probability of being absorbed by a molecule. The light essentially alters the molecular energy, causing the molecule to act differently than it was acting before the light was absorbed.
Читать дальшеИнтервал:
Закладка:
Похожие книги на «Continuous Emission Monitoring»
Представляем Вашему вниманию похожие книги на «Continuous Emission Monitoring» списком для выбора. Мы отобрали схожую по названию и смыслу литературу в надежде предоставить читателям больше вариантов отыскать новые, интересные, ещё непрочитанные произведения.


Обсуждение, отзывы о книге «Continuous Emission Monitoring» и просто собственные мнения читателей. Оставьте ваши комментарии, напишите, что Вы думаете о произведении, его смысле или главных героях. Укажите что конкретно понравилось, а что нет, и почему Вы так считаете.