James A. Jahnke - Continuous Emission Monitoring
Здесь есть возможность читать онлайн «James A. Jahnke - Continuous Emission Monitoring» — ознакомительный отрывок электронной книги совершенно бесплатно, а после прочтения отрывка купить полную версию. В некоторых случаях можно слушать аудио, скачать через торрент в формате fb2 и присутствует краткое содержание. Жанр: unrecognised, на английском языке. Описание произведения, (предисловие) а так же отзывы посетителей доступны на портале библиотеки ЛибКат.
- Название:Continuous Emission Monitoring
- Автор:
- Жанр:
- Год:неизвестен
- ISBN:нет данных
- Рейтинг книги:4 / 5. Голосов: 1
-
Избранное:Добавить в избранное
- Отзывы:
-
Ваша оценка:
Continuous Emission Monitoring: краткое содержание, описание и аннотация
Предлагаем к чтению аннотацию, описание, краткое содержание или предисловие (зависит от того, что написал сам автор книги «Continuous Emission Monitoring»). Если вы не нашли необходимую информацию о книге — напишите в комментариях, мы постараемся отыскать её.
The new edition of the only single-volume reference on both the regulatory and technical aspects of U.S. and international continuous emission monitoring (CEM) systems Continuous Emission Monitoring
Continuous Emission Monitoring:
Continuous Emission Monitoring, Third Edition
Continuous Emission Monitoring — читать онлайн ознакомительный отрывок
Ниже представлен текст книги, разбитый по страницам. Система сохранения места последней прочитанной страницы, позволяет с удобством читать онлайн бесплатно книгу «Continuous Emission Monitoring», без необходимости каждый раз заново искать на чём Вы остановились. Поставьте закладку, и сможете в любой момент перейти на страницу, на которой закончили чтение.
Интервал:
Закладка:
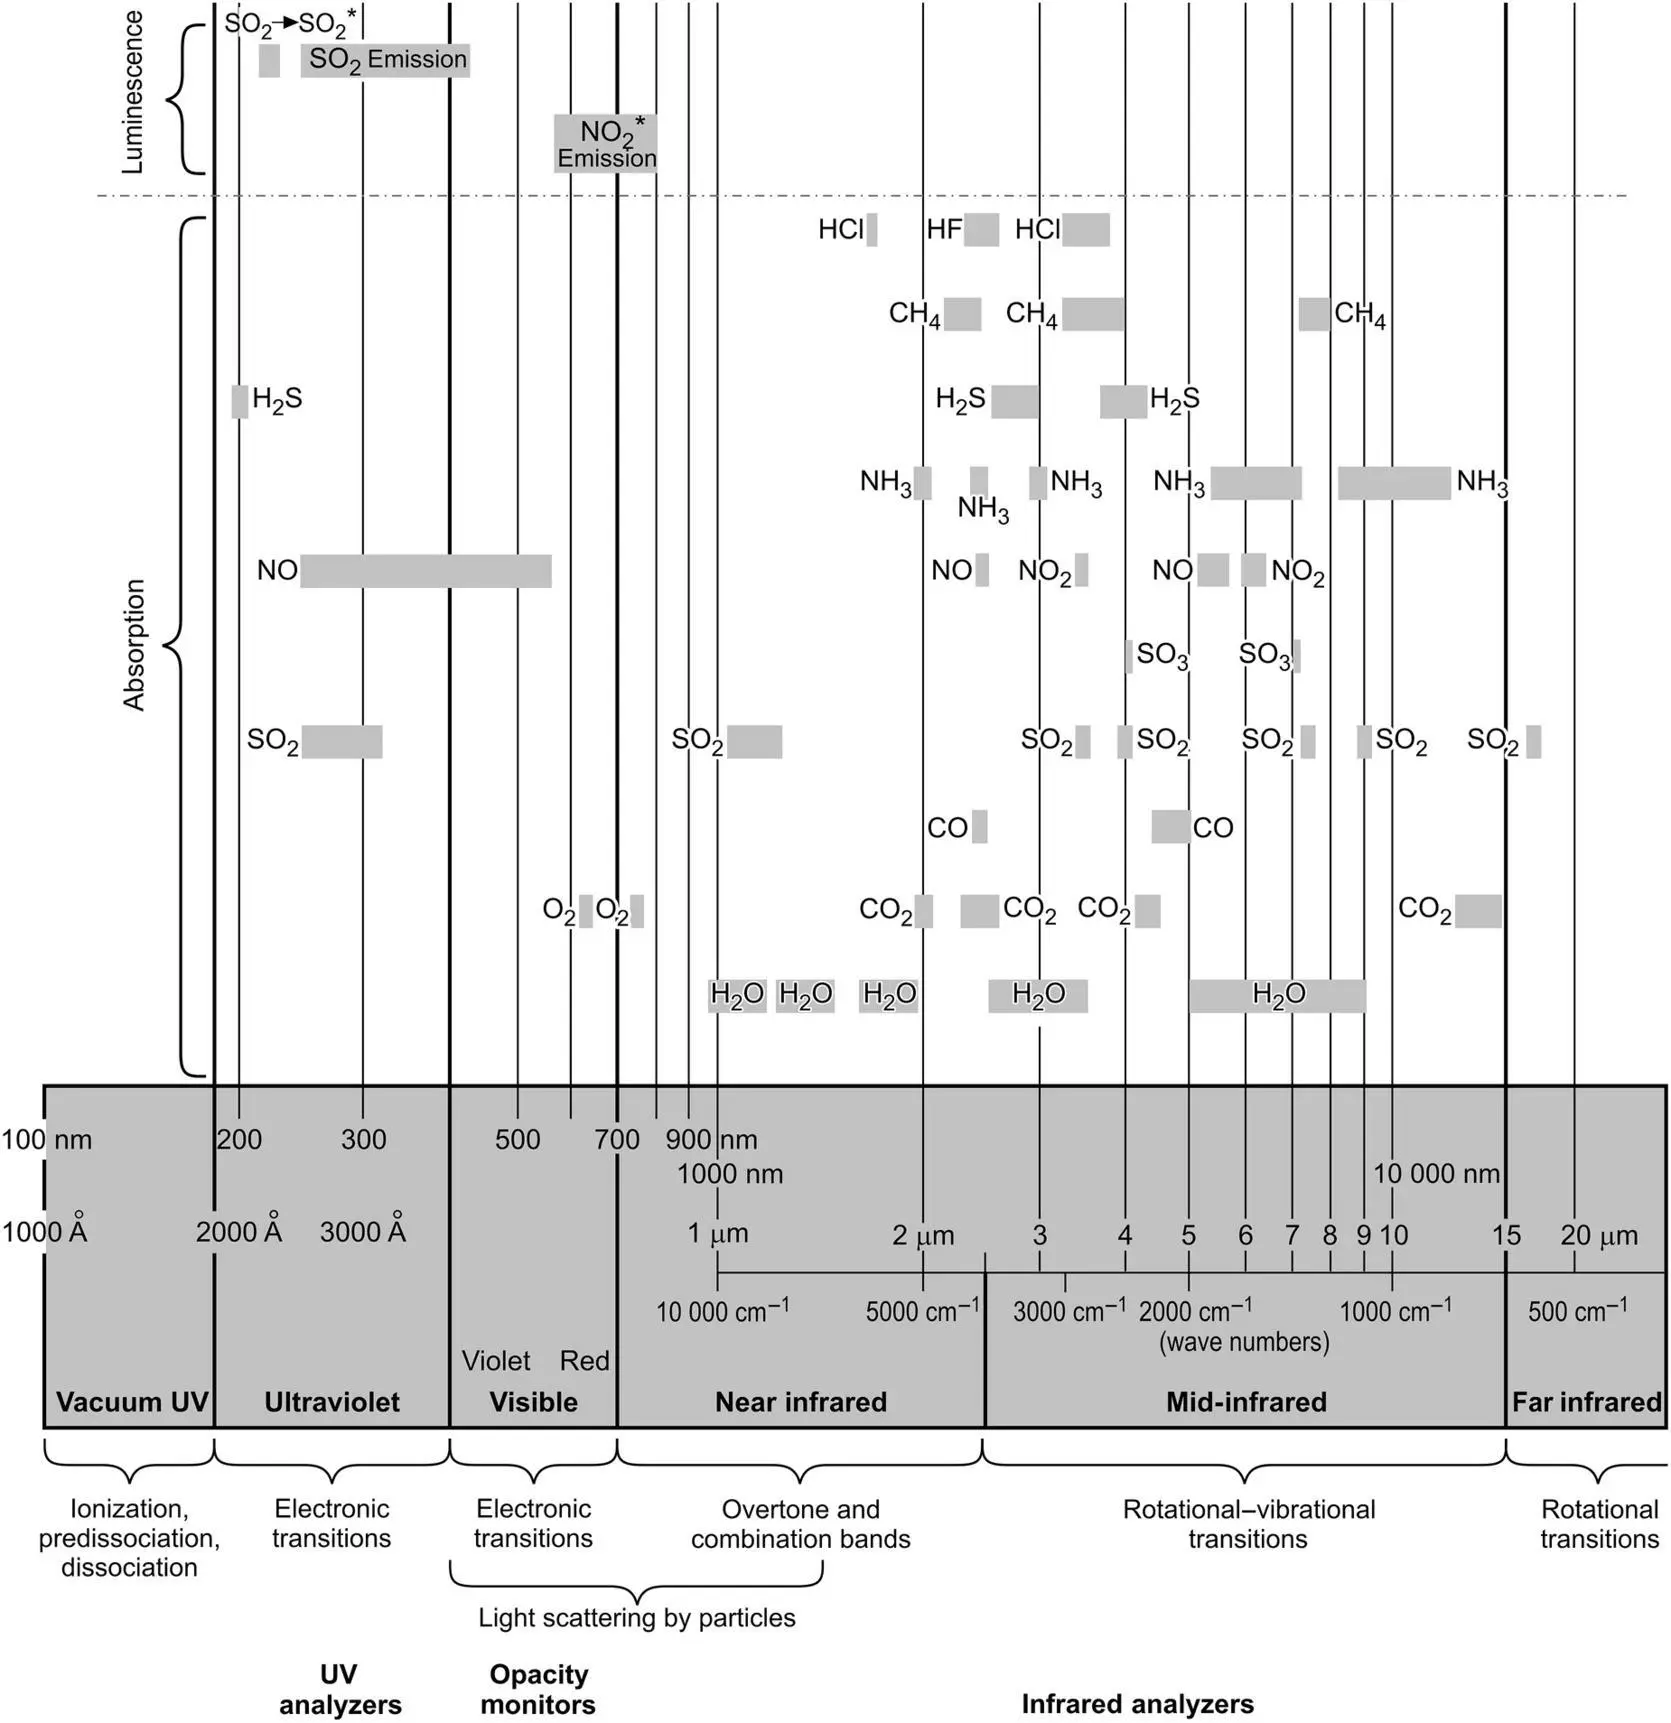
Figure 4‐2 The electromagnetic spectrum for continuous emission monitoring analyzers.
If the absorbed light is of low energy (long wavelength, low frequency: [ E = hv ]), the molecule will rotate differently than it did before. This occurs typically for light wavelengths in the far‐infrared region of the spectrum, at wavelengths greater than 20 μm. Light in the range of 5–20 μm can cause changes in the vibrational characteristics of a molecule. In the range of 0.8–5 μm, the more complex overtones and combinations of fundamental vibrations give rise to light absorption. Figure 4‐2illustrates the regions over the range of 0.8–20 μm (12 500–500 cm −1) in the infrared spectrum where typical pollutant and combustion gases absorb light due to vibrational–rotational transitions. Figure 4‐3illustrates some of the specific motions that occur when photons of the right energy (light of the right wavelength) are absorbed by an SO 2molecule.
In the ultraviolet and visible regions of the spectrum, 180–700 nm, impinging light can cause the molecular electrons to change their energy states. Here, higher‐energy photons cause the electrons to become excited, and in the far ultraviolet may even cause the molecules to dissociate. SO 2shows a particularly strong absorption centered at 280 nm, which is taken advantage of in several SO 2analyzers, as we shall see in the next chapter.
Each of these absorption processes requires a precise quantity of radiant energy. The probability of light being absorbed and the transition occurring is greatest when the value of hv equals that energy. If light passing through a gas contained in a cell is changed over a range of wavelengths, a detector located on the other side of the gas cell would sense a dip in the light intensity it receives at the wavelengths where these transitions occur. This is shown in Figure 4‐4. This absorption can also be plotted directly as an absorption spectrum as shown in Figure 4‐5. The absorption spectrum offers some advantages for quantitative analysis.

Figure 4‐3 Example of normal vibrations of the SO 2molecule.
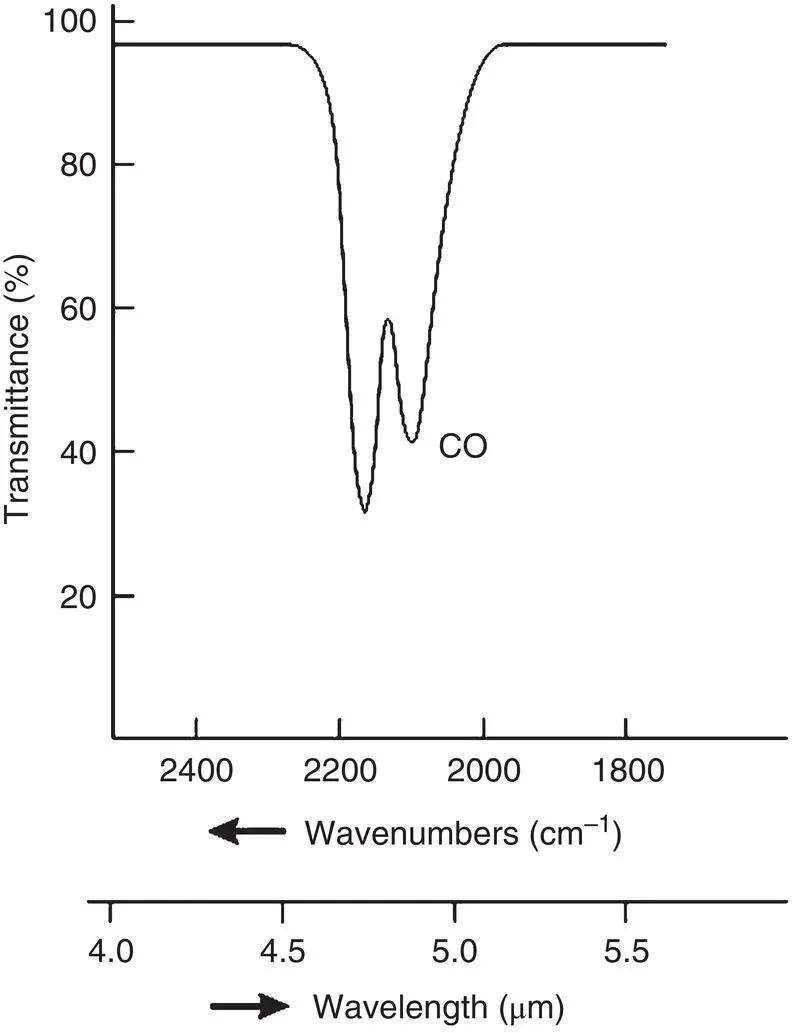
Figure 4‐4 A typical transmission spectrum.
Each electronic state of a molecule will contain many vibrational energy levels and each vibrational energy level will contain many rotational energy levels. This is illustrated in Figure 4‐6, which shows the possible energy states in which a molecule can exist. The molecule's energy state can be modified by supplying a photon of proper energy that can cause a transition from one state to another. Because there are a large number of states, there will also be a large number of wavelengths at which light will be absorbed.
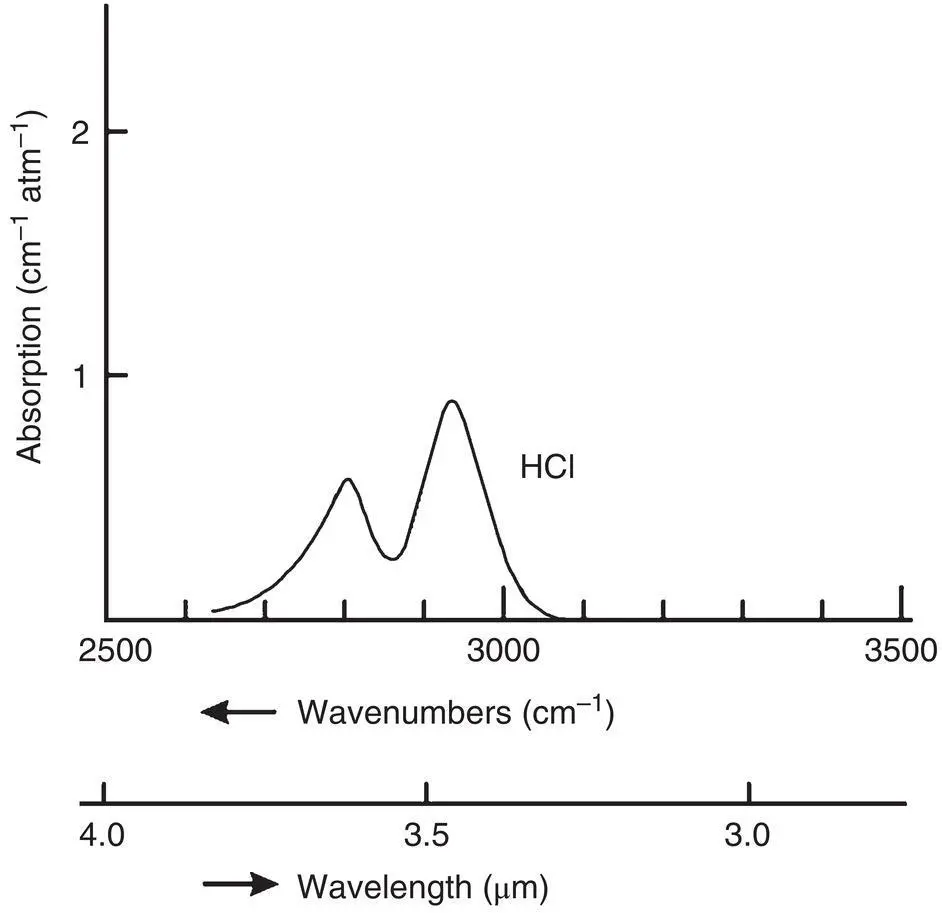
Figure 4‐5 A typical absorption spectrum.
The total energy of a molecule in a specific energy state can be summarized by the approximation
(4‐4) 
The fact that transitions can occur between many of these states implies that energy will be absorbed at many different wavelengths. This gives rise to an absorption spectrum that typifies a molecule. As an example, Figure 4‐7illustrates the vibrational–rotational absorption spectrum of SO 2in the near‐infrared region. Such spectra are very important in the development of analytical techniques for gas monitoring.
Also, Figure 4‐2shows that different molecules can absorb light in the same region of the spectrum. This can cause problems in developing an analyzer because it can be difficult to distinguish the relative amounts of absorption from each compound in the overlap region. Water vapor can be particularly troublesome because it absorbs in many regions of the infrared spectrum and is usually present at percent levels in the gas stream, whereas pollutant gases are present at ppm levels. Interfering gases can be removed before entering an analyzer, but this can be difficult and makes the monitoring system more complicated. An alternative to removing interfering gases is to select a region of the spectrum where there is no overlap. The wavelength‐specific light emitted by lasers has enabled a wide variety of instruments to be developed using this technique. High‐resolution instruments, once found only in the laboratory, provide another alternative. Advances in computerization along with advances in the science and technology of gas measurement have since made relatively sophisticated measurement techniques available to field instruments at reasonable cost. Different approaches to such problems are discussed further in the following chapters.
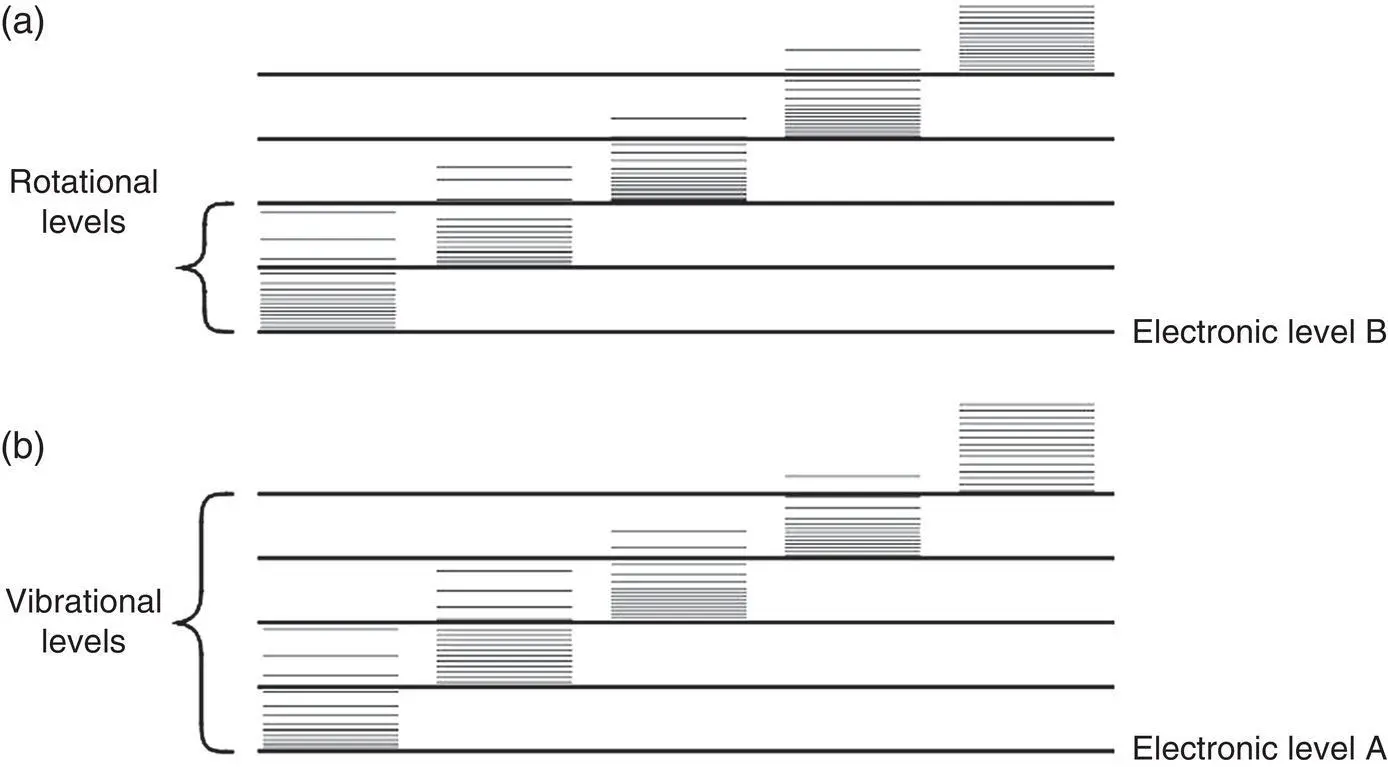
Figure 4‐6 Energy‐level diagram for a molecule.
To this point we have discussed the fact that molecules can absorb light energy. However, the question arises as to how this phenomenon can be expressed quantitatively. The answer lies in a mathematical expression known as the Beer–Lambert law.
The Beer–Lambert Law
When studying the absorption of light by gases, the Beer–Lambert law can be used to relate the amount of light absorbed to the concentration of the pollutant gas. First, consider the system shown in Figure 4‐8, which is composed of a light source, flue gas, and a sensor that measures light intensity.
The intensity of light passing through a stack (or sample cell) will decrease if gas molecules in the cell become “excited,” that is, if the light embodies wavelengths causing energy transitions in the molecule. Light transmittance, Tr , is the fraction of incident light passing through the cell. This can be expressed as the ratio of the light intensity transmitted through the cell, I , to the initial incident light intensity, I o, (or the intensity with no absorbing material in the stack or cell), or:
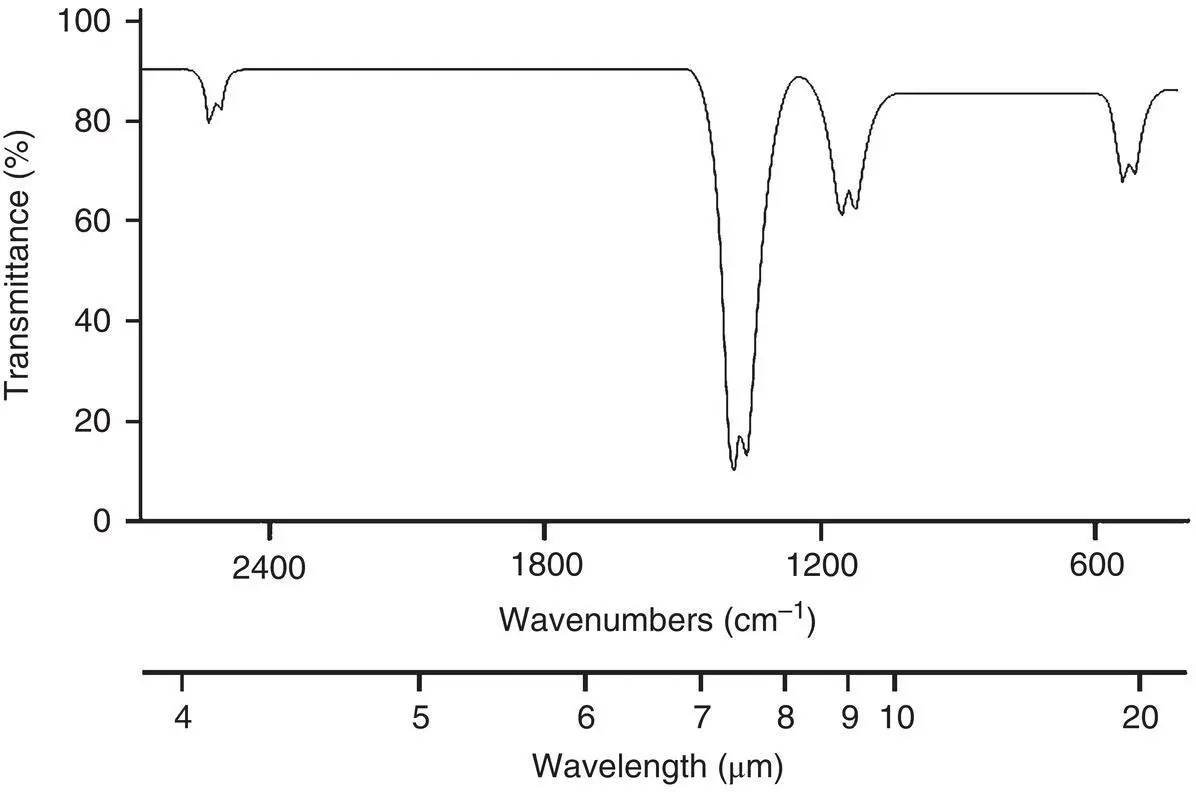
Figure 4‐7 Infrared vibrational–rotational transmittance spectrum for SO 2.
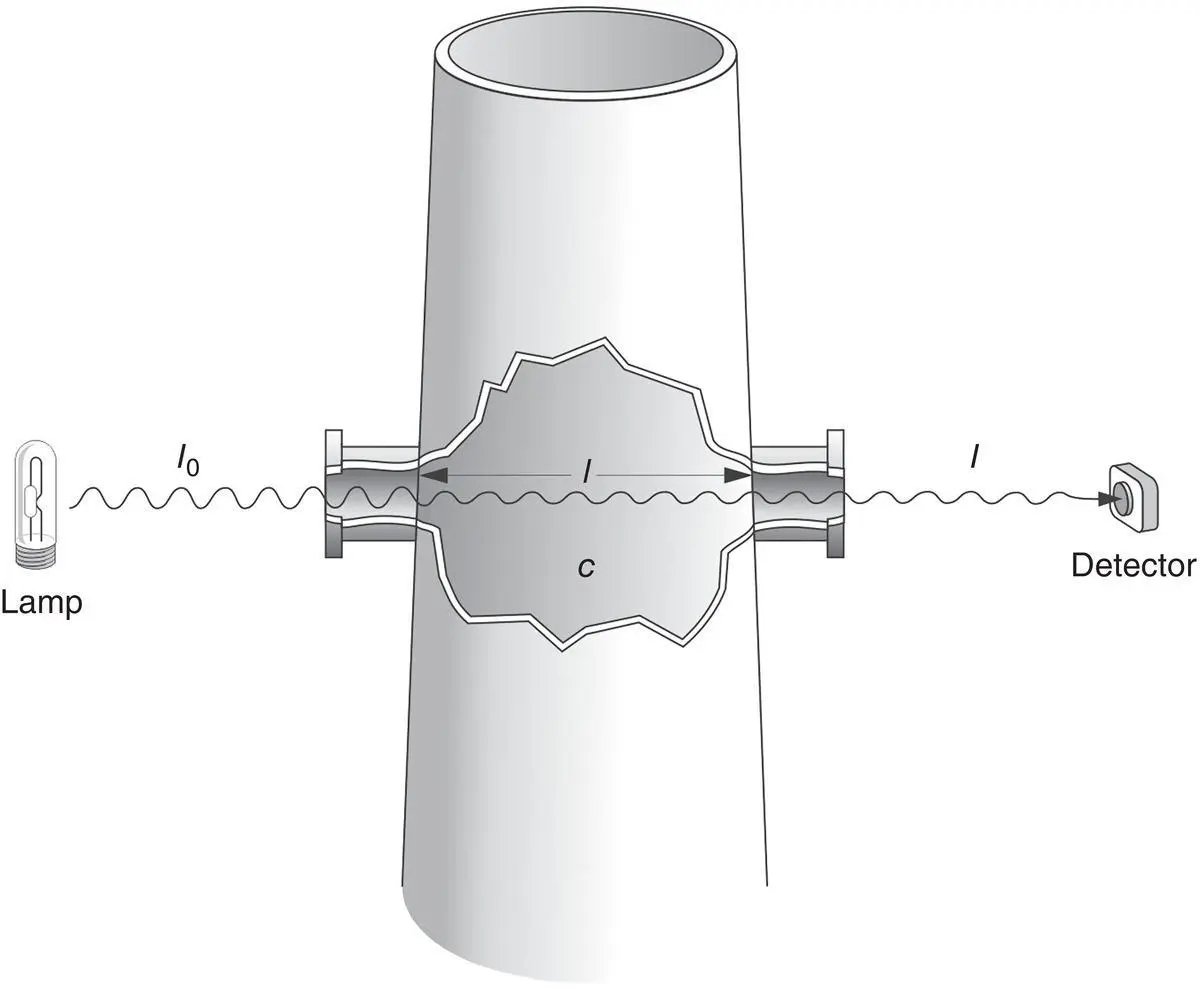
Figure 4‐8 Example system for measuring pollutant gas concentrations.
(4‐5) 
The Beer–Lambert law states that the transmittance of light through the medium decreases exponentially by the product α(λ) cL , or
Читать дальшеИнтервал:
Закладка:
Похожие книги на «Continuous Emission Monitoring»
Представляем Вашему вниманию похожие книги на «Continuous Emission Monitoring» списком для выбора. Мы отобрали схожую по названию и смыслу литературу в надежде предоставить читателям больше вариантов отыскать новые, интересные, ещё непрочитанные произведения.


Обсуждение, отзывы о книге «Continuous Emission Monitoring» и просто собственные мнения читателей. Оставьте ваши комментарии, напишите, что Вы думаете о произведении, его смысле или главных героях. Укажите что конкретно понравилось, а что нет, и почему Вы так считаете.