James A. Jahnke - Continuous Emission Monitoring
Здесь есть возможность читать онлайн «James A. Jahnke - Continuous Emission Monitoring» — ознакомительный отрывок электронной книги совершенно бесплатно, а после прочтения отрывка купить полную версию. В некоторых случаях можно слушать аудио, скачать через торрент в формате fb2 и присутствует краткое содержание. Жанр: unrecognised, на английском языке. Описание произведения, (предисловие) а так же отзывы посетителей доступны на портале библиотеки ЛибКат.
- Название:Continuous Emission Monitoring
- Автор:
- Жанр:
- Год:неизвестен
- ISBN:нет данных
- Рейтинг книги:4 / 5. Голосов: 1
-
Избранное:Добавить в избранное
- Отзывы:
-
Ваша оценка:
Continuous Emission Monitoring: краткое содержание, описание и аннотация
Предлагаем к чтению аннотацию, описание, краткое содержание или предисловие (зависит от того, что написал сам автор книги «Continuous Emission Monitoring»). Если вы не нашли необходимую информацию о книге — напишите в комментариях, мы постараемся отыскать её.
The new edition of the only single-volume reference on both the regulatory and technical aspects of U.S. and international continuous emission monitoring (CEM) systems Continuous Emission Monitoring
Continuous Emission Monitoring:
Continuous Emission Monitoring, Third Edition
Continuous Emission Monitoring — читать онлайн ознакомительный отрывок
Ниже представлен текст книги, разбитый по страницам. Система сохранения места последней прочитанной страницы, позволяет с удобством читать онлайн бесплатно книгу «Continuous Emission Monitoring», без необходимости каждый раз заново искать на чём Вы остановились. Поставьте закладку, и сможете в любой момент перейти на страницу, на которой закончили чтение.
Интервал:
Закладка:
(3‐9) 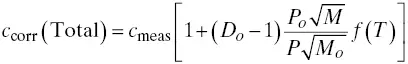
This equation has been shown to adequately represent the effect of pressure and molecular weight changes on dilution system data (note: it is simplified by not incorporating changes in specific heat) (Jahnke and Marshall 1994; McGowan 1994; Miller 1994). Critical orifice theory predicts that the temperature variation 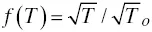 . However, this expression is incomplete since it does not account for changes in the dilution air temperature. Baugham (1996) has done this and has developed an instrument control method that corrects for both probe and dilution air temperature variations. In later work, Romero et al. (1999) and Batug et al. (2004) applied computational fluid dynamic techniques to develop a model for evaluating temperature, pressure, and molecular weight effects in the EPM dilution probe.
Equation 3‐9is especially useful for calculating molecular weight corrections that would apply to changing flue gas composition or cylinder gas audits using different gas blends. One can simply input the molecular weight of the initial calibration gas, M o,and correct subsequent readings if the molecular weight of the test gas, M , is known.
Note that these corrections may not be necessary if data are reported as an emission rate, E , in terms of lb/mmBtu (ng/J). If emissions are reported in units of lbs pollutant emitted/10 6Btu generated (or ng/J),
the F factor expression can be used (see Appendix A).
(3‐10) 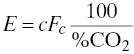
where
Fc = “F” factor in scf/106 Btu
c = pollutant gas concentration
Because the pollutant concentration is divided by percent CO 2, any constant change in the dilution ratio cancels out in the concentration ratio. When reporting emission mass rates in pounds/hour, the pollutant mass rate equation is not expressed in a form where flue gas density effects on the dilution ratio cancel, and changes in the flue gas density must be taken into account.
Other Correction Methods.
In conjunction with Pennsylvania Power and Light (PPL), the Lehigh University Energy Research Center developed a dilution ratio calculation system called “DRCalc ™” (Batug et al. 2004; Romero et al. 1999, 2002, 2005). After the dilution ratio is set initially, this system provides corrections for changes in the dilution air supply pressure, dilution air supply temperature, stack pressure and temperature, the sampled gas molecular weight, and the calibration gas molecular weight. Signals from temperature, pressure, and sensors, in addition to flue gas composition data, are sent to the DRCalc ™unit, where proprietary software is used to continually recalculate the dilution ratio. This system has been patented (Batug et al. 2004) and was successfully applied at PPL facilities (Sale 2000a, b). It also incorporates an algorithm for changes in the dilution probe flue gas temperature, f(T).
For the EPM dilution probe, an apparatus has been designed (Baugham 1996, 1997) that uses a regulator to adjust the flow of dilution air to maintain a consistent dilution ratio to compensate for gas density changes. The advantage of this apparatus is that it can easily retrofitted into existing systems without having to make computational changes in the data acquisition system. Atmospheric and stack pressure and sample temperature are monitored to provide inputs into the system. Equation 3‐6is used to adjust for sample temperature changes. The system can also provide for changes in gas density as the flue gas moisture or oxygen concentrations vary.
The Electric Power Research Institute developed an algorithm for in‐stack and external dilution system corrections in their “CEMS Analyzer Bias and Linearity Effects (CABLE) study” (Berry 2000). The study was conducted to improve the accuracy of CEM systems used in the acid rain program and provided recommendations for the implementation of a correction algorithm based on Equation 3‐9. In this algorithm, the temperature dependence, f(T), was expressed empirically as f 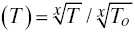 when the study data were found not to follow the theoretical relation
 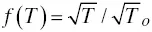 . Here, x , is determined for each individual dilution system. Step‐by‐step procedures and a logic diagram for implementation of the dilution ratio correction routine can be found in an EPRI report of the study (Berry 1999).
Dilution Extractive Systems: Wet or Dry Measurement?
A question that frequently arises when considering the use of a dilution system is whether the emission values are given on a wet basis or a dry basis. Dilution systems that do not dry the diluted sample gas give concentration values (ppm) on a wet basis. If there is no moisture removal, there will still be moisture in the diluted sample. When the diluted concentration (measured with ambient air level analyzers) is scaled back up by multiplying it by the dilution ratio, the moisture content is scaled back up also. The concentration of the pollutant gas in the original wet sample is obtained.
Consider an example of 1 ml of flue gas that contains 0.1 ml of water vapor (10% H 2O), which is diluted with 99 ml of dry air ( Figure 3‐27). In the diluted sample, the percentage of water vapor is reduced to about 0.1% of the total volume. Essentially, the analyzer is measuring SO 2in a background gas containing 99.9% dry gas and 0.1% water vapor. Therefore, the flue gas SO 2concentration obtained is given on a wet basis. When the diluted concentration is scaled back up by multiplying it by the dilution ratio, the concentration of SO 2in the original wet sample is obtained.
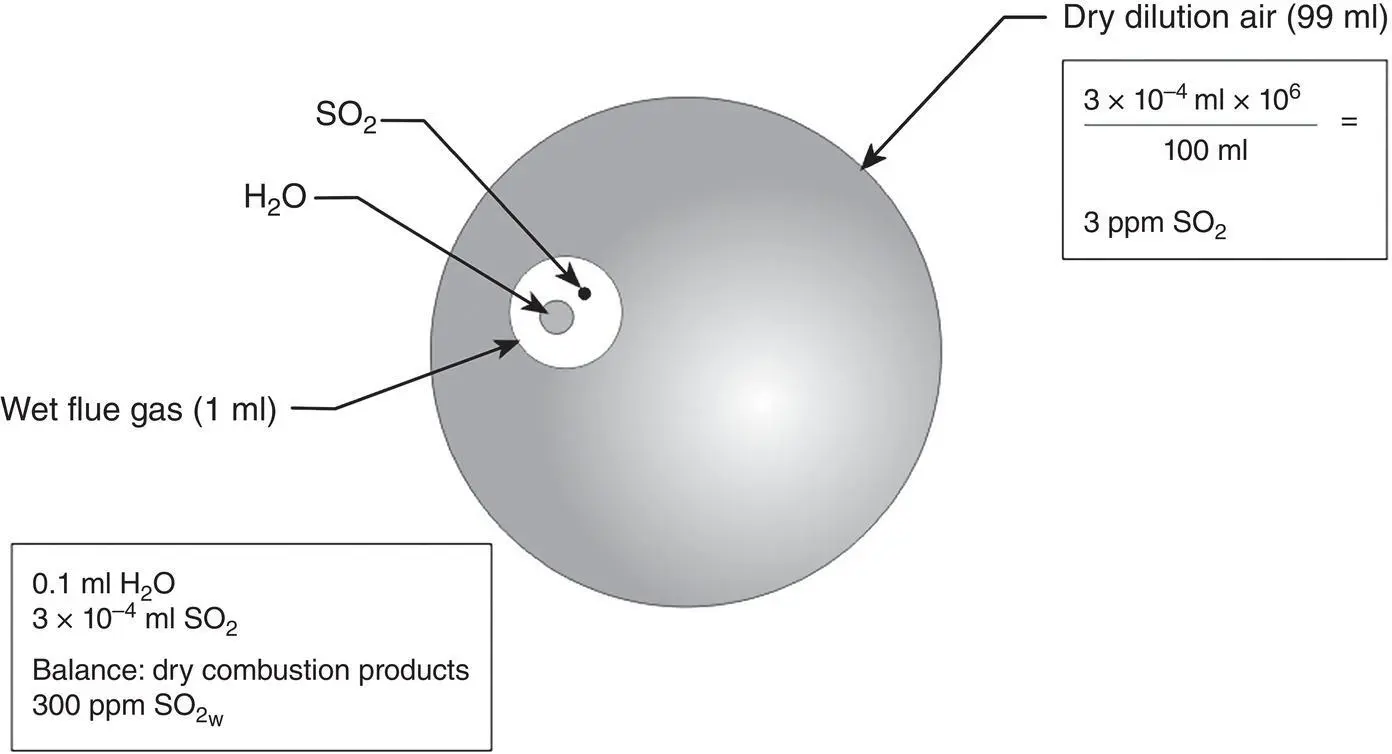
Figure 3‐27 Example of a wet flue gas being diluted with dry air.
Consider again from Figure 3‐27that the diluted SO 2concentration is measured to be 3 ppm. This means that for every 100 ml of gas analyzed, the volume of SO 2equals 3 × 10 −6× 100 = 3 × 10 −4ml. However, because no SO 2is in the dry air used for dilution, this must be the volume of SO 2gas contained in the 1 ml of flue gas drawn into the dilution system. A volume of 3 × 10 −4ml in 1 ml is equivalent to a flue gas concentration of 3 × 10 −4× 10 6= 300 ppm. Because, in this example, the 1 ml of flue gas sample also contains 0.1 ml of water vapor, the 300 ppm value is actually a wet‐basis value.
To report a dry‐basis SO 2emission concentration, the moisture content must be known. It can be calculated by using Equation 3‐11:
(3‐11) 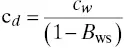
where
cd = dry‐basis concentration value (ppm or percent)
cw = wet‐basis concentration value (ppm or percent)
Bws = the moisture fraction of the flue gas
Читать дальшеИнтервал:
Закладка:
Похожие книги на «Continuous Emission Monitoring»
Представляем Вашему вниманию похожие книги на «Continuous Emission Monitoring» списком для выбора. Мы отобрали схожую по названию и смыслу литературу в надежде предоставить читателям больше вариантов отыскать новые, интересные, ещё непрочитанные произведения.


Обсуждение, отзывы о книге «Continuous Emission Monitoring» и просто собственные мнения читателей. Оставьте ваши комментарии, напишите, что Вы думаете о произведении, его смысле или главных героях. Укажите что конкретно понравилось, а что нет, и почему Вы так считаете.