Christopher Hallinan - Embedded Linux Primer - A Practical, Real-World Approach
Здесь есть возможность читать онлайн «Christopher Hallinan - Embedded Linux Primer - A Practical, Real-World Approach» весь текст электронной книги совершенно бесплатно (целиком полную версию без сокращений). В некоторых случаях можно слушать аудио, скачать через торрент в формате fb2 и присутствует краткое содержание. Год выпуска: 2006, ISBN: 2006, Издательство: Prentice Hall, Жанр: ОС и Сети, на английском языке. Описание произведения, (предисловие) а так же отзывы посетителей доступны на портале библиотеки ЛибКат.

- Название:Embedded Linux Primer: A Practical, Real-World Approach
- Автор:
- Издательство:Prentice Hall
- Жанр:
- Год:2006
- ISBN:978-0-13-167984-9
- Рейтинг книги:4 / 5. Голосов: 1
-
Избранное:Добавить в избранное
- Отзывы:
-
Ваша оценка:
Embedded Linux Primer: A Practical, Real-World Approach: краткое содержание, описание и аннотация
Предлагаем к чтению аннотацию, описание, краткое содержание или предисловие (зависит от того, что написал сам автор книги «Embedded Linux Primer: A Practical, Real-World Approach»). Если вы не нашли необходимую информацию о книге — напишите в комментариях, мы постараемся отыскать её.
This book brings together indispensable knowledge for building efficient, high-value, Linux-based embedded products: information that has never been assembled in one place before. Drawing on years of experience as an embedded Linux consultant and field application engineer, Christopher Hallinan offers solutions for the specific technical issues you're most likely to face, demonstrates how to build an effective embedded Linux environment, and shows how to use it as productively as possible.
Hallinan begins by touring a typical Linux-based embedded system, introducing key concepts and components, and calling attention to differences between Linux and traditional embedded environments. Writing from the embedded developer's viewpoint, he thoroughly addresses issues ranging from kernel building and initialization to bootloaders, device drivers to file systems.
Hallinan thoroughly covers the increasingly popular BusyBox utilities; presents a step-by-step walkthrough of porting Linux to custom boards; and introduces real-time configuration via CONFIG_RT--one of today's most exciting developments in embedded Linux. You'll find especially detailed coverage of using development tools to analyze and debug embedded systems--including the art of kernel debugging.
• Compare leading embedded Linux processors
• Understand the details of the Linux kernel initialization process
• Learn about the special role of bootloaders in embedded Linux systems, with specific emphasis on U-Boot
• Use embedded Linux file systems, including JFFS2--with detailed guidelines for building Flash-resident file system images
• Understand the Memory Technology Devices subsystem for flash (and other) memory devices
• Master gdb, KGDB, and hardware JTAG debugging
• Learn many tips and techniques for debugging within the Linux kernel
• Maximize your productivity in cross-development environments
• Prepare your entire development environment, including TFTP, DHCP, and NFS target servers
• Configure, build, and initialize BusyBox to support your unique requirements
Embedded Linux Primer: A Practical, Real-World Approach — читать онлайн бесплатно полную книгу (весь текст) целиком
Ниже представлен текст книги, разбитый по страницам. Система сохранения места последней прочитанной страницы, позволяет с удобством читать онлайн бесплатно книгу «Embedded Linux Primer: A Practical, Real-World Approach», без необходимости каждый раз заново искать на чём Вы остановились. Поставьте закладку, и сможете в любой момент перейти на страницу, на которой закончили чтение.
Интервал:
Закладка:
BUG: soft lockup detected on CPU0
When this message is emitted by the kernel, it is usually accompanied by a backtrace and other information such as the process name and PID. It will look similar to a kernel oops message complete with processor registers. See .../kernel/softlockup.c for details. This information can be used to help track down the source of the lockup condition.
17.4.2. Preemption Debugging
To enable preemption debugging, enable CONFIG_DEBUG_PREEMPT in the kernel configuration. This debug feature enables the detection of unsafe use of preemption semantics such as preemption count underflows and attempts to sleep while in an invalid context. To use it, simply enable the feature and watch for any reports on the console or system log. Here is just a small sample of reports possible when preemption debugging is enabled:
BUG: , possible wake_up race on
BUG: lock recursion deadlock detected!
BUG: nonzero lock count at exit time?
Many more messages are possiblethese are just a few examples of the kinds of problems that can be detected. These messages will help you avoid deadlocks and other erroneous or dangerous programming semantics when using real-time kernel features. For more details on the messages and conditions under which they are emitted, browse the Linux kernel source file .../kernel/rt-debug.c.
17.4.3. Debug Wakeup Timing
To enable wakeup timing, enable CONFIG_WAKEUP_TIMING in the kernel configuration. This debug option enables measurement of the time taken from waking up a high-priority process to when it is scheduled on a CPU. Using it is simple. When configured, measurement is disabled. To enable the measurement, do the following as root:
# echo '0' >/proc/sys/kernel/preempt_max_latency
When this /proc file is set to zero, each successive maximum wakeup timing result is written to this file. To read the current maximum, simply display the value:
# cat /proc/sys/kernel/preempt_max_latency
84
As long as any of the latency-measurement modes are enabled in the kernel configuration, preempt_max_latency will always be updated with the maximum latency value. It cannot be disabled. Writing 0 to this /proc variable simply resets the maximum to zero to restart the cumulative measurement.
17.4.4. Wakeup Latency History
To enable wakeup latency history, enable CONFIG_WAKEUP_LATENCY_HIST while CONFIG_WAKEUP_TIMING is also enabled. This option dumps all the wakeup timing measurements enabled by CONFIG_WAKEUP_TIMING into a file for later analysis. An example of this file and its contents is presented shortly when we examine interrupt off history.
• CRITICAL_PREEMPT_TIMING : Measures the time spent in critical sections with preempt disabled.
• PREEMPT_OFF_HIST : Similar to WAKEUP_LATENCY_HIST. Gathers preempt off timing measurements into a bin for later analysis.
17.4.5. Interrupt Off Timing
To enable measurement of maximum interrupt off timing, configure your kernel with CRITICAL_IRQSOFF_TIMING enabled. This option measures time spent in critical sections with irqs disabled. This feature works in the same way as wakeup latency timing. To enable the measurement, do the following as root:
# echo '0' >/proc/sys/kernel/preempt_max_latency
When this /proc file is set to zero, each successive maximum interrupt off timing result is written to this file. To read the current maximum, simply display the value:
# cat /proc/sys/kernel/preempt_max_latency
97
You will notice that the latency measurements for both wakeup latency and interrupt off latency are enabled and displayed using the same /proc file. This means, of course, that only one measurement can be configured at a time, or the results might not be valid. Because these measurements add significant runtime overhead, it isn't wise to enable them all at once anyway.
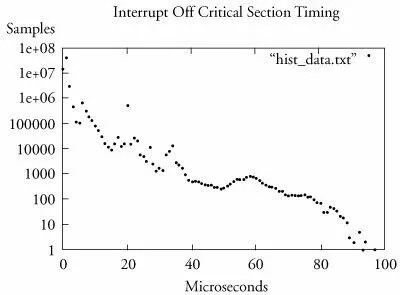
17.4.6. Interrupt Off History
Enabling INTERRUPT_OFF_HIST provides functionality similar to that with WAKEUP_LATENCY_HIST. This option gathers interrupt off timing measurements into a file for later analysis. This data is formatted as a histogram, with bins ranging from 0 microseconds to just over 10,000 microseconds. In the example just given, we saw that the maximum latency was 97 microseconds from that particular sample. Therefore, we can conclude that the latency data in histogram form will not contain any useful information beyond the 97-microsecond bin.
History data is obtained by reading a special /proc file. This output is redirected to a regular file for analysis or plotting as follows:
# cat /proc/latency_hist/interrupt_off_latency/CPU0 > hist_data.txt
Listing 17-6 displays the first 10 lines of the history data.
Listing 17-6. Interrupt Off Latency History (Head)
$ cat /proc/latency_hist/interrupt_off_latency/CPU0 | head
#Minimum latency: 0 microseconds.
#Average latency: 1 microseconds.
#Maximum latency: 97 microseconds.
#Total samples: 60097595
#There are 0 samples greater or equal than 10240 microseconds
#usecs samples
0 13475417
1 38914907
2 2714349
3 442308
...
From Listing 17-6 we can see the minimum and maximum values, the average of all the values, and the total number of samples. In this case, we accumulated slightly more than 60 million samples. The histogram data follows the summary and contains up to around 10,000 bins. We can easily plot this data using gnuplot as shown in Figure 17-5.
Figure 17-5. Interrupt off latency data
17.4.7. Latency Tracing
The LATENCY_TRACE configuration option enables generation of kernel trace data associated with the last maximum latency measurement. It is also made available through the /proc file system. A latency trace can help you isolate the longest-latency code path. For each new maximum latency measurement, an associated trace is generated that facilitates tracing the code path of the associated maximum latency.
Listing 17-7 reproduces an example trace for a 78-microsecond maximum. As with the other measurement tools, enable the measurement by writing a 0 to /proc/sys/kernel/preempt_max_latency.
Listing 17-7. Interrupt Off Maximum Latency Trace
$ cat /proc/latency_trace
preemption latency trace v1.1.5 on 2.6.14-rt-intoff-tim_trace
-------------------------------------------------------------
latency: 78 us, #50/50, CPU#0 | (M:rt VP:0, KP:0, SP:1 HP:1)
-----------------
| task: softirq-timer/0-3 (uid:0 nice:0 policy:1 rt_prio:1)
-----------------
_------=> CPU#
/ _-----=> irqs-off
| / _----=> need-resched
|| / _---=> hardirq/softirq
||| / _--=> preempt-depth
|||| /
||||| delay
cmd pid ||||| time | caller
\ / ||||| \ | /
cat-6637 0D... 1us : common_interrupt ((0))
cat-6637 0D.h. 2us : do_IRQ (c013d91c 0 0)
cat-6637 0D.h1 3us+: mask_and_ack_8259A (__do_IRQ)
Интервал:
Закладка:
Похожие книги на «Embedded Linux Primer: A Practical, Real-World Approach»
Представляем Вашему вниманию похожие книги на «Embedded Linux Primer: A Practical, Real-World Approach» списком для выбора. Мы отобрали схожую по названию и смыслу литературу в надежде предоставить читателям больше вариантов отыскать новые, интересные, ещё непрочитанные произведения.


Обсуждение, отзывы о книге «Embedded Linux Primer: A Practical, Real-World Approach» и просто собственные мнения читателей. Оставьте ваши комментарии, напишите, что Вы думаете о произведении, его смысле или главных героях. Укажите что конкретно понравилось, а что нет, и почему Вы так считаете.