Chris Tyler - Fedora Linux
Здесь есть возможность читать онлайн «Chris Tyler - Fedora Linux» весь текст электронной книги совершенно бесплатно (целиком полную версию без сокращений). В некоторых случаях можно слушать аудио, скачать через торрент в формате fb2 и присутствует краткое содержание. Год выпуска: 2006, ISBN: 2006, Издательство: O'Reilly, Жанр: ОС и Сети, на английском языке. Описание произведения, (предисловие) а так же отзывы посетителей доступны на портале библиотеки ЛибКат.

- Название:Fedora Linux
- Автор:
- Издательство:O'Reilly
- Жанр:
- Год:2006
- ISBN:978-0-596-52682-5
- Рейтинг книги:5 / 5. Голосов: 1
-
Избранное:Добавить в избранное
- Отзывы:
-
Ваша оценка:
Fedora Linux: краткое содержание, описание и аннотация
Предлагаем к чтению аннотацию, описание, краткое содержание или предисловие (зависит от того, что написал сам автор книги «Fedora Linux»). Если вы не нашли необходимую информацию о книге — напишите в комментариях, мы постараемся отыскать её.
Fedora Linux: A Complete Guide to Red Hat's Community Distribution In this book, you'll learn how to:
Install Fedora and perform basic administrative tasks
Configure the KDE and GNOME desktops
Get power management working on your notebook computer and hop on a wired or wireless network
Find, install, and update any of the thousands of packages available for Fedora
Perform backups, increase reliability with RAID, and manage your disks with logical volumes
Set up a server with file sharing, DNS, DHCP, email, a Web server, and more
Work with Fedora's security features including SELinux, PAM, and Access Control Lists (ACLs)
Whether you are running the stable version of Fedora Core or bleeding-edge Rawhide releases, this book has something for every level of user. The modular, lab-based approach not only shows you how things work - but also explains why--and provides you with the answers you need to get up and running with Fedora Linux.
Fedora Linux — читать онлайн бесплатно полную книгу (весь текст) целиком
Ниже представлен текст книги, разбитый по страницам. Система сохранения места последней прочитанной страницы, позволяет с удобством читать онлайн бесплатно книгу «Fedora Linux», без необходимости каждый раз заново искать на чём Вы остановились. Поставьте закладку, и сможете в любой момент перейти на страницу, на которой закончили чтение.
Интервал:
Закладка:
This feature is not available in Konqueror.
4.8.3.2. ...changing the group of a file graphically?
The permissions tab of the file properties window in both Nautilus ( Figure 4-12 ) and Konqueror has a drop-down menu that permits you to change the group ownership if you are a member of multiple groups and you own the file.
4.8.3.3. ...deleting someone else's file in /tmp?
/tmp is a special directory used to store temporary files ( /var/tmp is another). Since this directory is shared among all users, the sticky bit has been set to prevent users from deleting one other's files.
4.8.3.4. ...changing a file's owner and group at the same time?
The chown command permits you to specify a group after the username, separated by a colon. To make /tmp/input owned by the user barbara and the group smilies , use:
# chown barbara:smilies /tmp/input
4.8.4. Where Can I Find More Information?
The manpages for chmod , chown , chgrp , newgrp , id , ulimit , umask , and groups
"User Private Groups" in the Red Hat Linux 9 manual: http://www.redhat.com/docs/manuals/linux/RHL-9-Manual/ref-guide/s1-users-groups-private-groups.html
4.9. Managing Processes
A process is a running instance of a program. If you run a program twice, two processes are created. In order to manage a Fedora system effectively, you must be able to monitor and control processes.
4.9.1. How Do I Do That?
Fedora provides multiple tools to monitor process activity and resource usage, modify process priority, and terminate processes.
Processes are identified by a Process ID (PID) number, which is sequentially assigned. There is a small set of information associated with each process, including:
nice
A value used to alter a process's scheduling priority, which determines how much CPU time the process receives. The actual priority assigned to a process is calculated based upon this factor, as well as how much CPU time the process has recently received and how many input/output (I/O) operations it has recently performed. This value is inherited by child processes.
parent process ID
The PID of the process that started the process. If the parent process disappears, this is replaced by 1 (the init process).
real user ID and effective user ID
The numeric user ID of the user actually running the program and the effective user running the program. These can be different only when the suid mechanism is active (see Lab 4.8, "Control Access to Files "), although an effective user ID remains in effect when a suid program calls a non- suid program.
real group ID and effective group ID
The numeric group ID of the group actually running the program and the effective group running the program. These are similar to the real and effective user IDs in that they will be different only when the sgid mechanism is active.
umask
The permission mask received from the parent process.
tty
The terminal associated with the program (if applicable). This permits all programs on that terminal to receive a hangup signal (HUP) when the terminal connection is lost, which is the case when a telephone modem call is hung up, a terminal window is closed, or a remote access Telnet/SSH session is terminated. This value is inherited by child processes.
It's important to realize that at any particular point in time, most processes are sleeping while they wait for some resource to become available. That resource might be a mouse click, a keystroke, a network packet, some data from disk, or a particular time of day.
4.9.1.1. Monitoring process information graphically in GNOME
The menu item Applications→System Tools→System Monitor will run gnome-system-monitor and present the display shown in Figure 4-13.
Figure 4-13. GNOME System Monitor window
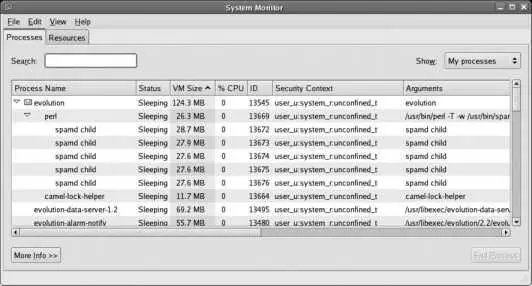
This display has two tabs:
Processes
Displays a table of current processes with information about each.
Resources
Displays scrolling graphs displaying CPU, memory, and swap usage.
By default, the Processes tab displays the name of the program executing, process status (Sleeping or Running), Virtual Memory (VM) size, percentage of CPU time, the SELinux Security Context, and the arguments used on the command line that started the process (including the command name).
The default display shows the most useful information about each process, but to configure the display to your liking, you can:
Add and remove fields
Select Edit→Preferences to view a list of available fields (columns) with a checkbox for each. Check or uncheck items to add them to or remove them from the list. Close this window when you are done editing the field list.
Reorder and resize columns
Drag column headings to rearrange the order in which they are displayed. To change a column width, click between it and an adjacent column, and then drag to the desired width.
Sort a column
Click on a column heading to select that column for the sort sequence. An arrow will appear in the header (as shown on the VM Size column in Figure 4-13 ); click on the heading again to toggle between ascending and descending sort order.
Filter by process type
The Show menu lets you select your own processes, all processes on the system, or just the active (running, not sleeping) processes.
To terminate a process, highlight it by clicking on it and then click the End Process button, type Alt-P, or right-click on the process and select End Process. If that doesn't cause the process to terminate within a few seconds, right-click on the process and select Kill Process (or highlight the process and type Ctrl-K).
You won't be able to terminate processes owned by other users (including system processes) this way because you have insufficient permission. It is possible to run this program as root , which will let you terminate any process:
# gnome-system-monitor
Terminating the wrong process(es) can leave your system in a partially functioning or unusable state, and it may be necessary to reboot the system to recover. Be careful!
4.9.1.2. Monitoring process information graphically in KDE
If you're using KDE in Fedora, the menu item System→KSysGuard will start ksysguard and display the window shown in Figure 4-14.
Figure 4-14. KSysGuard window
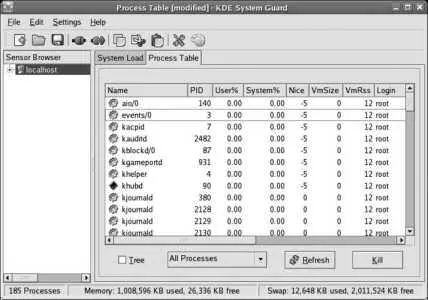
This tool is very customizable, but the basic display is similar to the GNOME System Monitor, except that the CPU usage is broken down into User% and System%, and the memory size is broken down into VmSize (total process size) and VmRSS (Resident Set Size, the portion of the VmSize currently in memory instead of swap). Use the Process Table tab to monitor and control running processes.
To customize the display, you can:
Show and hide columns
To remove a column from the display, right-click somewhere within that column (not on the heading) and select Hide Column. To add a column, right-click in an existing column (again, not on the heading), and select Show Column and then the column name you wish to add.
Читать дальшеИнтервал:
Закладка:
Похожие книги на «Fedora Linux»
Представляем Вашему вниманию похожие книги на «Fedora Linux» списком для выбора. Мы отобрали схожую по названию и смыслу литературу в надежде предоставить читателям больше вариантов отыскать новые, интересные, ещё непрочитанные произведения.


Обсуждение, отзывы о книге «Fedora Linux» и просто собственные мнения читателей. Оставьте ваши комментарии, напишите, что Вы думаете о произведении, его смысле или главных героях. Укажите что конкретно понравилось, а что нет, и почему Вы так считаете.