SS
Здесь есть возможность читать онлайн «SS» весь текст электронной книги совершенно бесплатно (целиком полную версию без сокращений). В некоторых случаях можно слушать аудио, скачать через торрент в формате fb2 и присутствует краткое содержание. Жанр: Справочники, на английском языке. Описание произведения, (предисловие) а так же отзывы посетителей доступны на портале библиотеки ЛибКат.
- Название:SS
- Автор:
- Жанр:
- Год:неизвестен
- ISBN:нет данных
- Рейтинг книги:5 / 5. Голосов: 1
-
Избранное:Добавить в избранное
- Отзывы:
-
Ваша оценка:
SS: краткое содержание, описание и аннотация
Предлагаем к чтению аннотацию, описание, краткое содержание или предисловие (зависит от того, что написал сам автор книги «SS»). Если вы не нашли необходимую информацию о книге — напишите в комментариях, мы постараемся отыскать её.
SS — читать онлайн бесплатно полную книгу (весь текст) целиком
Ниже представлен текст книги, разбитый по страницам. Система сохранения места последней прочитанной страницы, позволяет с удобством читать онлайн бесплатно книгу «SS», без необходимости каждый раз заново искать на чём Вы остановились. Поставьте закладку, и сможете в любой момент перейти на страницу, на которой закончили чтение.
Интервал:
Закладка:
Why should a customer buy these services?
Why should they buy these services from us?
What are the pricing or chargeback model s?
What are our strengths and weaknesses, priorities and risk ?
How should our resource s and capabilities be allocated?
Organization s embarking on a service-orientation journey have a tendency to view it as a series of tactical programme s. Armed with a conceptual understanding of services, organizations frequently rush to industrialize service outcomes. The impulse is to launch initiatives in organizational change or process redesign. While these are important fulfilment elements, there is an order worth noting.
While this order is not absolute it does serve two purposes. First, it warns against missteps such as performing organizational design before knowing what services to offer, or performing a tool selection before optimizing processes. Second, it signals the early need for a Service Portfolio , one of the most vital yet often missing constructs for driving service strategies and managing service investments.
Financial managers tailor a portfolio of investments based on their customer’s risk and reward profile. Regardless of the profile, the objective is the same: maximize return at an acceptable risk level. When conditions change, appropriate changes are made to the portfolio. There is a need for applying comparable practices when managing a portfolio of services. The value of a Service Portfolio strategy is demonstrated through the ability to anticipate change while maintaining traceability to strategy and planning .
Service portfolio management is a dynamic method for governing investments in service management across the enterprise and managing them for value.
The operative word is method. Often the term portfolio is marginalized to a list of services, application s, asset s or project s. A portfolio is essentially a group of investments that share similar characteristics. They are grouped by size, discipline or strategic value. There are few fundamental differences between IT portfolio management, project portfolio management and SPM. All are enabling techniques for governance . The difference is in the implementation details.
5.3.1 Business service and IT Service
A business process can be distributed across technologies and applications, span geographies, have many user s, and yet still reside in one place: the data centre. To integrate business process, IT frequently employs bottom-up integration, stitching together a patchwork of technology and application component s that were never designed to interact at the business process layer. What began as an elegant top-down business design frequently deteriorates into a disjointed and inflexible IT solution, disconnected from the goals of the business .
An improved strategy for engaging at the business process layer is focusing on model led abstractions of business activities. These focal points, called business service s, represent business activities with varying degrees of granularity and functionality. A business process, for example, may be represented as a single business service or a collection of business services (Figure 5.11). A business service can represent a composite application or a discrete application function . It may represent a discrete transaction or a collection of supporting fulfilment elements. In all cases, it exists in the domain of the business.
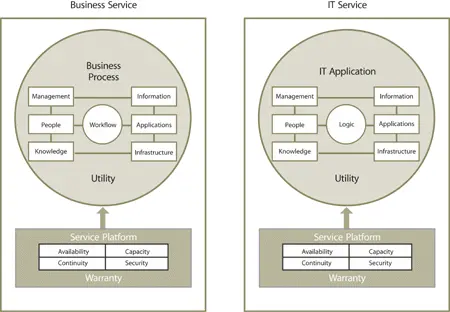
Figure 5.11 Business service and IT Service
A business service is defined by the business . If IT provides a service to the business, but the business does not think of the service in any business context or semantics, then it is an IT Service . By considering services as a system for creating and capturing value, regardless of sourcing or underpinnings, the line between IT Services and business services begins to blur. Instead, each can be thought of as different perspectives across a spectrum. Again, the decision to adopt a business or IT perspective depends on the context of the customer. When this notion is combined with other seemingly unrelated service-oriented technologies and concepts, their relationships can be illustrated in the chart shown in Figure 5.12.
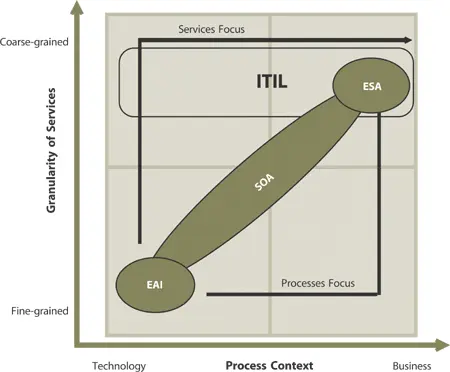
Figure 5.12 Service perspectives
Figure 5.12 states that all services, whether they are IT Services, business services or services based on Service-oriented Architecture (SOA), Enterprise Services Architecture (ESA) or Enterprise Application Integration (EAI), are members of the same family. They may differ by granularity (fine versus coarse) or by context (technology versus business ). They each provide a basis for value and require governance , delivery and support. ITSM and BSM are each perspectives on the same concept: service management.
5.3.1.1 IT Service Management
The organization chart shown in Figure 5.13 is a collection of functional boxes representing vertical tiers of reporting relationships.
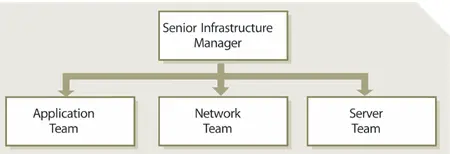
Figure 5.13 Simplified vertical view of an IT organization
While the organization chart is a useful administrative tool, it is missing key components. It is missing the customers. It is missing the services provided to the customers. And it is missing the workflow through which those services are provided. In other words, the organizational chart does not show what the organization does, how it does it and for whom it does it.
Goal setting and reporting are done in silos. The criteria for employees are based on expertise for a specific technology or role , rather than competencies in strategic planning , business expertise, forecasting, or managing metric s. Each technology or functional manager perceives the other as a competitor rather than a partner; positioning themselves for priority , resource s, budget and advancement.
This approach prevents cross-silo issues from being resolved at low levels. Instead, the issues are escalated to functional managers who then address the issues with other functional managers. The result is then communicated downward, at which point the real work presumably begins. In other words, managers are continually forced to resolve low-level issues, taking time away from high-level customer issues. Low-level contributors, rather than resolving these issues, then see themselves as passive implementers, merely taking orders and providing technical information. Cross-functional issues frequently do not get addressed, often falling through the organizational cracks.
The opportunity for improving an organization often lies in these cracks: the white space of the organization chart. (The ‘white space’ of the organization chart is examined in Rummler.26) It is the points at which the boxes interface and pass information. While an organizational chart does fulfil an important administrative purpose, it should not be confused with the organization itself. This confusion may lead managers to manage the organization chart, rather than the organization. Rather, they should overcome inter-silo problems by conceptualizing and managing complete processes (Figure 5.14).
Читать дальшеИнтервал:
Закладка:
Обсуждение, отзывы о книге «SS» и просто собственные мнения читателей. Оставьте ваши комментарии, напишите, что Вы думаете о произведении, его смысле или главных героях. Укажите что конкретно понравилось, а что нет, и почему Вы так считаете.