Dawn Willoughby - Numbers - B2+
Здесь есть возможность читать онлайн «Dawn Willoughby - Numbers - B2+» — ознакомительный отрывок электронной книги совершенно бесплатно, а после прочтения отрывка купить полную версию. В некоторых случаях можно слушать аудио, скачать через торрент в формате fb2 и присутствует краткое содержание. Жанр: unrecognised, на английском языке. Описание произведения, (предисловие) а так же отзывы посетителей доступны на портале библиотеки ЛибКат.
- Название:Numbers: B2+
- Автор:
- Жанр:
- Год:неизвестен
- ISBN:нет данных
- Рейтинг книги:4 / 5. Голосов: 1
-
Избранное:Добавить в избранное
- Отзывы:
-
Ваша оценка:
Numbers: B2+: краткое содержание, описание и аннотация
Предлагаем к чтению аннотацию, описание, краткое содержание или предисловие (зависит от того, что написал сам автор книги «Numbers: B2+»). Если вы не нашли необходимую информацию о книге — напишите в комментариях, мы постараемся отыскать её.
Numbers: B2+ — читать онлайн ознакомительный отрывок
Ниже представлен текст книги, разбитый по страницам. Система сохранения места последней прочитанной страницы, позволяет с удобством читать онлайн бесплатно книгу «Numbers: B2+», без необходимости каждый раз заново искать на чём Вы остановились. Поставьте закладку, и сможете в любой момент перейти на страницу, на которой закончили чтение.
Интервал:
Закладка:
Exercise 14
Put the words in brackets into the correct position and form in each sentence.
1The x axis goes ________and the y axis goes ________. (horizontal / vertical)
2A ________goes vertically and a ________goes horizontally. (row / column)
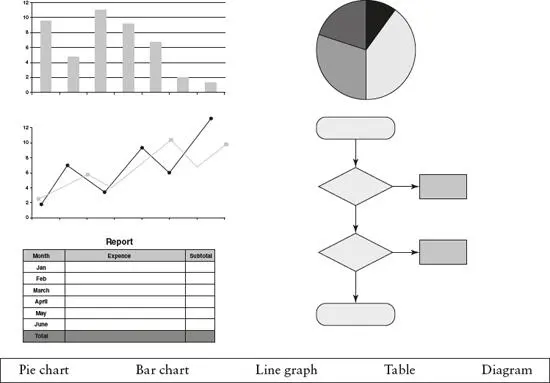
3A ________is used to ________a ________. With a ________the ________needs to be labelled. (label / key / pie chart / line graph / axis)
4How many ________are there in the ________above? (segment / pie chart)
5Graphics in academic writing are often referred to as ________but sometimes as ________or tables. (chart / figure)
6Pie charts are generally used to show the ________of something and line graphs to show ________. (trend / proportion)
Referring to graphics in writing
Although graphics generally speak for themselves, it is common to make a brief reference to them in writing to introduce what they show. This can be done with a range of basic phrases, for example:
As can be seen in Figure 12.1, …
From Table 2.1, it can be concluded that …
Language: relative clauses
Relative clauses can be a useful structure for summarizing or referring to key information in a graphic. For example:
The graph shows the number of students from India who were given visas in 2010 was 58,000.
The table shows that the number of students who come from the USA is getting bigger.
In academic writing, relative clauses are often used for defining; in the case of data, they are used to describe or define exactly who or what you are referring to. Note that the relative pronoun ( who, whose, which, that ) will change depending on what you are defining. For people, use who, that or whose (possessive):
 The graph shows people who are motivated by goals often have short-term satisfaction.
The graph shows that people that set realistic goals often enhance their performance.
The chart demonstrates that companies whose managers are not aware of employee motivation are less likely to be successful.
For most things or ideas, use that or which :
The table shows companies that use money as a means to motivate employees .
The table shows teams which use a sports psychologist to motivate teams .
For more information on describing graphics, see Chapters 8and 9.

Exercise 15
Complete the table with words from the box.
As is shown graph 2.3 in It can be seen from
| As can be seen | from 2 ________ | Table 3.2, Figure 9.6 3 ________ | … that … |
| It can be seen | |||
| 1 ________ | in | ||
| According to | |||
| 4 ________ |
Exercise 16
Match 1–5 with a–e to form sentences including a relative clause.
| 1The charts shows that students are more likely to borrow a book | awhose job is under threat are likely to be demotivated. |
| 2The table shows employees | bwho have both intrinsic and extrinsic motivation are more likely to succeed. |
| 3The chart shows people | cwhich students find more challenging. |
| 4The chart shows areas of study | dwho receive praise outperform others. |
| 5The chart shows that workers | ethat is recommended by a course tutor. |
Tip
Try to record all new vocabulary in a similar way and regularly test yourself on the new words.
Remember
 You might have to use spreadsheets to analyse your data.
The main purpose and use of statistics.
Relative clauses are useful for referring to and labelling graphics in writing.
The different stages from collection to presentation of data.
2 Starting Primary Research
Aims
 practise formulating research questions
understand the principles of sampling
learn how to formulate a hypothesis

Quiz
Self-evaluation
Read the statements below. Circle the answers that are true for you.
| 1I know how to start a primary research project. | agree | disagree | not sure |
| 2I know how to create an effective sample. | agree | disagree | not sure |
| 3I know which research method is most appropriate for my aims. | agree | disagree | not sure |
| 4I know how to formulate a hypothesis. | agree | disagree | not sure |
Early planning and good organization are key to a successful research project. What you decide to research can vary greatly depending on the field you are in, but there are two main starting points: formulating research questions, or formulating a hypothesis to test. Whether you choose one, the other or both, there are some important points to consider:
Does this area interest you enough? After all, this project will become a large part of your life for quite some time.
Has this area been researched before? If so, what new things are you hoping to add with this study?
How does this build on previous research in the area?
Are the research aims focused and limited enough? You will have a limited amount of time and words to complete the project, so it needs to be realistic.
Do you have access to a reasonable cross-section of the population you wish to study?
Интервал:
Закладка:
Похожие книги на «Numbers: B2+»
Представляем Вашему вниманию похожие книги на «Numbers: B2+» списком для выбора. Мы отобрали схожую по названию и смыслу литературу в надежде предоставить читателям больше вариантов отыскать новые, интересные, ещё непрочитанные произведения.


Обсуждение, отзывы о книге «Numbers: B2+» и просто собственные мнения читателей. Оставьте ваши комментарии, напишите, что Вы думаете о произведении, его смысле или главных героях. Укажите что конкретно понравилось, а что нет, и почему Вы так считаете.