Dawn Willoughby - Numbers - B2+
Здесь есть возможность читать онлайн «Dawn Willoughby - Numbers - B2+» — ознакомительный отрывок электронной книги совершенно бесплатно, а после прочтения отрывка купить полную версию. В некоторых случаях можно слушать аудио, скачать через торрент в формате fb2 и присутствует краткое содержание. Жанр: unrecognised, на английском языке. Описание произведения, (предисловие) а так же отзывы посетителей доступны на портале библиотеки ЛибКат.
- Название:Numbers: B2+
- Автор:
- Жанр:
- Год:неизвестен
- ISBN:нет данных
- Рейтинг книги:4 / 5. Голосов: 1
-
Избранное:Добавить в избранное
- Отзывы:
-
Ваша оценка:
Numbers: B2+: краткое содержание, описание и аннотация
Предлагаем к чтению аннотацию, описание, краткое содержание или предисловие (зависит от того, что написал сам автор книги «Numbers: B2+»). Если вы не нашли необходимую информацию о книге — напишите в комментариях, мы постараемся отыскать её.
Numbers: B2+ — читать онлайн ознакомительный отрывок
Ниже представлен текст книги, разбитый по страницам. Система сохранения места последней прочитанной страницы, позволяет с удобством читать онлайн бесплатно книгу «Numbers: B2+», без необходимости каждый раз заново искать на чём Вы остановились. Поставьте закладку, и сможете в любой момент перейти на страницу, на которой закончили чтение.
Интервал:
Закладка:
11/3 ________
2245 × 6 ________
398% ________
4100 ml ________

Exercise 4
Put the word in brackets into the correct form in each of these sentences.
1The closest ________was 2 years 4 months. (estimate)
2There are a number of different ways to ________an average. (calculate)
3There are ________1.3 billion people in China. (approximate)
4The ________of another variable completely changed the outcome of the experiment. (add)
5The values were ________and then used to find the average. (total)
6The answers were cross-checked to ________predict the outcome. (accurate)
What is statistics?
Every day in our lives, we hear and read about many different types of information in the form of data. Data can tell us interesting and important details about the world around us but it can be challenging to understand the facts and figures.
Statistics is a mathematical science that helps us to make sense of data that has been counted, measured, asked about or observed. It involves four main activities:
Glossary
methodA method is a particular way of doing something.
techniqueA technique is a particular method of doing an activity, usually a method that involves practical skills.
Collecting data– first of all, we decide what type of data we are interested in, which method we shall use to collect the data, and where we would like to collect it from.
Organizing data– we use a range of different techniques to summarize the data we have collected so that we can see interesting features or patterns in the information.
Interpreting data– we use the results of calculations to help us make comparisons about different sets of data, to answer questions and make decisions about the world around us.
Glossary
featureA feature of something is an interesting or important part or characteristic of it.
Presenting data– when we have found out interesting facts about our data, then we will need to display and present the information to other people so that they can understand our conclusions.
Exercise 5
Choose a newspaper or news-related website and look for reports that use statistics to help explain the main points of the article. Think about these questions:
 How was the data collected?
What type of organization is using the statistics?
What interesting features or patterns were found in the data?
How is the data presented?
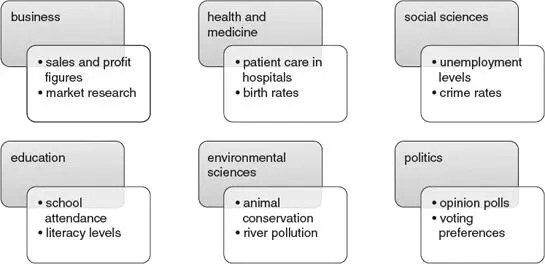
Statistics is important in many different subject areas. The following diagram lists some examples of the type of data that might be collected and used:
Some terminology
In statistics, we use two key words: variable and observation. It is important to understand the difference in their meanings. A variable is a characteristic or an attribute that can have different values; an observation is the value of a variable that has actually been counted, measured or observed. Some variables are shown below, with a list of possible observations next to each one.
Glossary
variableA variable is a factor that can change in quality, quantity, or size, which you have to take into account in a situation.
characteristicThe characteristics of a person or thing are the qualities or features that belong to them and make them recognizable.
attributeAn attribute is a quality or feature that someone or something has.
| Variable | Observations |
| favourite colour | purple, blue, orange |
| number of pets | 3, 1, 0 |
| time spent reading | 2 hours, 1 hour |
| number of children in a family | 1, 5, 2 |
| eye colour | brown, blue |
| number of letters in a name | 10, 4, 8 |
The observations for a variable can be described as quantitativeor qualitative, depending on what the information is about. Quantitative data is something which can be measured or counted using a number. Qualitative data represents a characteristic that uses words to describe it but does not use any numbers.
Examples of quantitative variables are:
time taken to complete a test
the number of books in a library
the highest temperature in a month
Examples of qualitative variables are:
the nationality of people in a cinema
the favourite sport of children in a school
the colours of balloons at a party
Exercise 6
Match the words on the left to their definitions on the right.
| 1A variable | aData which can be measured or counted using a number. |
| 2An observation | bThe value of a variable that has actually been counted, measured or observed. |
| 3Quantitative | cData representing a characteristic that uses words to describe it but does not use any numbers. |
| 4Qualitative | dA characteristic or an attribute that can have different values. |
Exercise 7
State whether each of the following variables is quantitative or qualitative:
1number of pages in a book
2names of students in a class
3hair colour
4weight of apples in a bag
5height of trees in a park
Exercise 8
Answer these questions.
1Explain the difference between a quantitative and a qualitative variable.
2Give an example of each type of variable.
3Explain why:
‘type of tree’ is a qualitative variable
‘number of pupils in a class’ is a quantitative variable
Exercise 9
Читать дальшеИнтервал:
Закладка:
Похожие книги на «Numbers: B2+»
Представляем Вашему вниманию похожие книги на «Numbers: B2+» списком для выбора. Мы отобрали схожую по названию и смыслу литературу в надежде предоставить читателям больше вариантов отыскать новые, интересные, ещё непрочитанные произведения.


Обсуждение, отзывы о книге «Numbers: B2+» и просто собственные мнения читателей. Оставьте ваши комментарии, напишите, что Вы думаете о произведении, его смысле или главных героях. Укажите что конкретно понравилось, а что нет, и почему Вы так считаете.