Chris Jones - End-to-end Data Analytics for Product Development
Здесь есть возможность читать онлайн «Chris Jones - End-to-end Data Analytics for Product Development» — ознакомительный отрывок электронной книги совершенно бесплатно, а после прочтения отрывка купить полную версию. В некоторых случаях можно слушать аудио, скачать через торрент в формате fb2 и присутствует краткое содержание. Жанр: unrecognised, на английском языке. Описание произведения, (предисловие) а так же отзывы посетителей доступны на портале библиотеки ЛибКат.
- Название:End-to-end Data Analytics for Product Development
- Автор:
- Жанр:
- Год:неизвестен
- ISBN:нет данных
- Рейтинг книги:3 / 5. Голосов: 1
-
Избранное:Добавить в избранное
- Отзывы:
-
Ваша оценка:
End-to-end Data Analytics for Product Development: краткое содержание, описание и аннотация
Предлагаем к чтению аннотацию, описание, краткое содержание или предисловие (зависит от того, что написал сам автор книги «End-to-end Data Analytics for Product Development»). Если вы не нашли необходимую информацию о книге — напишите в комментариях, мы постараемся отыскать её.
• Presents a guide to innovation feasibility and formulation and process development
• Contains the statistical tools used to solve challenges faced during product innovation and feasibility
• Offers information on stability studies which are common especially in chemical or pharmaceutical fields
• Includes a companion website which contains videos summarizing main concepts
Written for undergraduate students and practitioners in industry,
offers resources for the planning, conducting, analyzing and interpreting of controlled tests in order to develop effective products and processes.
End-to-end Data Analytics for Product Development — читать онлайн ознакомительный отрывок
Ниже представлен текст книги, разбитый по страницам. Система сохранения места последней прочитанной страницы, позволяет с удобством читать онлайн бесплатно книгу «End-to-end Data Analytics for Product Development», без необходимости каждый раз заново искать на чём Вы остановились. Поставьте закладку, и сможете в любой момент перейти на страницу, на которой закончили чтение.
Интервал:
Закладка:
In some contexts, you may find different terminology used to refer to similar data types. In quality control, categorical and discrete data are referred to as attributes and continuous data as variables .
When performing a statistical analysis, take into account the type of variable(s) you have, i.e. is it qualitative or quantitative? Different graphs, descriptive statistics, and inferential procedures must be used to study different types of data.
Stat Tool 1.2 Statistical Unit, Population, Sample 
A statistical unit is the unit of observation (e.g. entity, person, object, product) for which data are collected. For each statistical unit, qualitative or quantitative variables are observed or measured.
The whole set of statistical units is the population . It may also be virtually infinite (e.g. all products of a production process).
A sample is a subset of statistical units (sampling units) selected from the population in a suitable way. The sample size of a study is the total number of sampling units (see Figure 1.1).
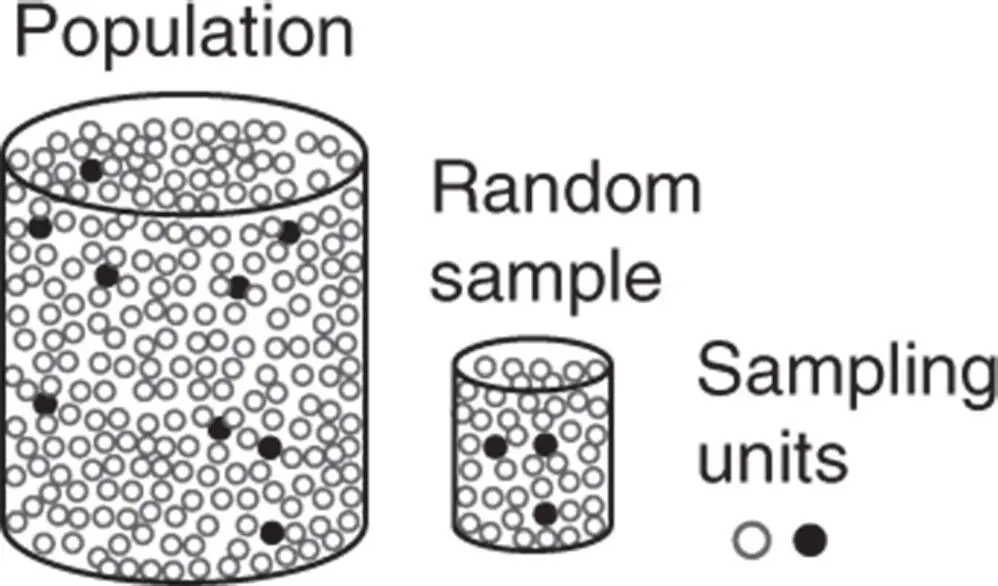
Figure 1.1 Population, samples, sampling units.
When we use a sample to draw conclusions about a population, sample selection must be performed at random . Random sampling is carried out in such a way as to ensure that no element in the population is given preference over any other. Random sampling is used to avoid nonrepresentative samples of the population.
In Example 1.1 the statistical unit is the single respondent.
Stat Tool 1.3Descriptive and Inferential Analysis
Usually, the first step of a statistical analysis is descriptive analysis , where tables, graphs, and simple measures help to quickly assess and summarize important aspects of sample data.
When performing descriptive analysis, take into account the type of variable(s) present, i.e. is it qualitative (categorical) or quantitative? Different graphs, descriptive statistics, and inferential procedures have to be used to study different types of data.
The descriptive phase evaluates the following aspects: 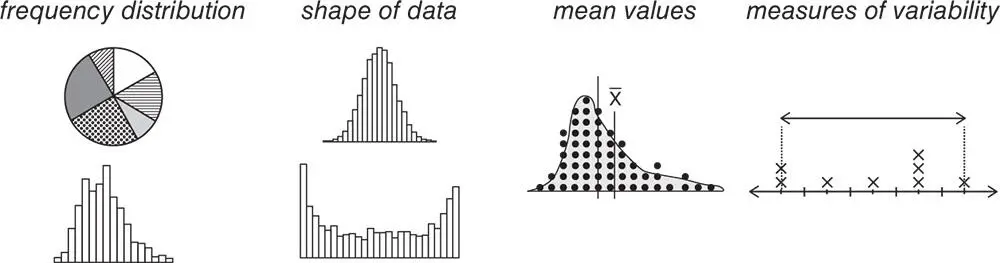
After outlining important sample data characteristics through descriptive statistics, the second step of a statistical analysis is inferential analysis , where sample findings are generalized to the referring population.
We often wish to answer questions about our processes or products to make improvements and predictions, save money and time, and increase customer satisfaction:
What is the stability of a new formulation?
What is the performance of a new product compared with the industry standard or products currently on the market?
What is causing high levels of variation and waste during processing?
These questions are examples of inferential problems .
Inferential problems are usually related to:
| Estimation of a population parameter (e.g. a mean) |  |
What is the stability of a new formulation? |
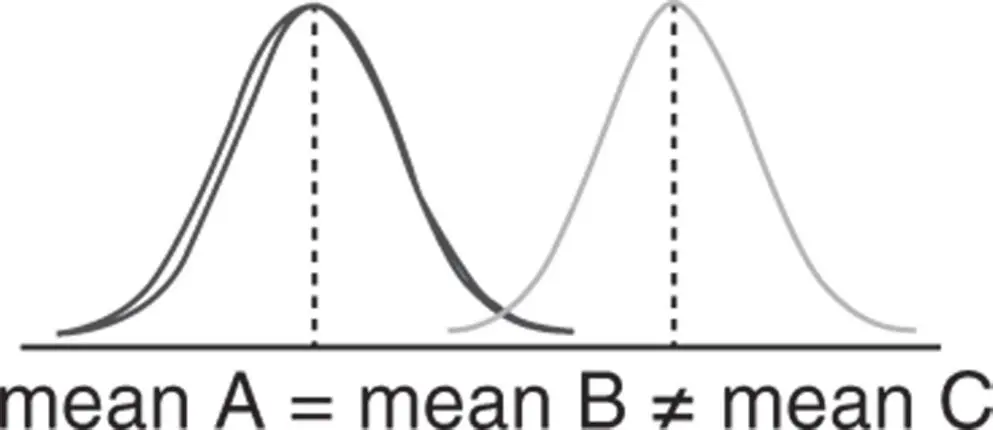
| Comparison among groups | |
What is the performance of a new product compared with the industry standard or products currently on the market? |
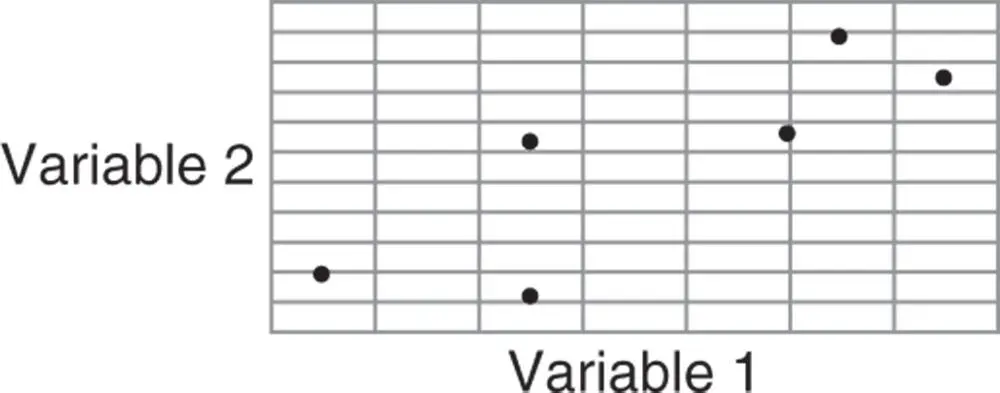
| Assessing relationships among variables | |
What is causing high levels of variation and waste during processing? |
We can use several inferential techniques to answer different questions. Later on, we will review the following ones:
| Estimation of a population parameter:Point estimateConfidence intervals | |
 |
| Comparison among groups:Hypothesis testing (one‐sample tests; two‐sample tests; ANOVA) | |
 |
| Assessing relationships among variables:Regression models | |
 |
Stat Tool 1.4 Shapes of Data Distributions
Frequency distributions may be shown by tables or graphs. Use bar charts for categorical or quantitative discrete variables, histograms for continuous variables, and dot plots (especially useful for small data sets) for discrete or continuous variables.
By observing the frequency distribution of a categorical or quantitative variable, several shapes may be detected:
When values or classes have similar percentages, the distribution is said to be fairly uniform. In a fairly uniform distribution there are no values or classes predominant over the others (a).
When there is one value or class predominant over the others, the distribution is said to be nonuniform and unimodal with one peak (b).
When there is more than one value or class predominant over the others, the distribution is said to be nonuniform and multimodal with more than one peak (c).
The value or class with the highest frequency is the mode of the distribution (see Figure 1.2).
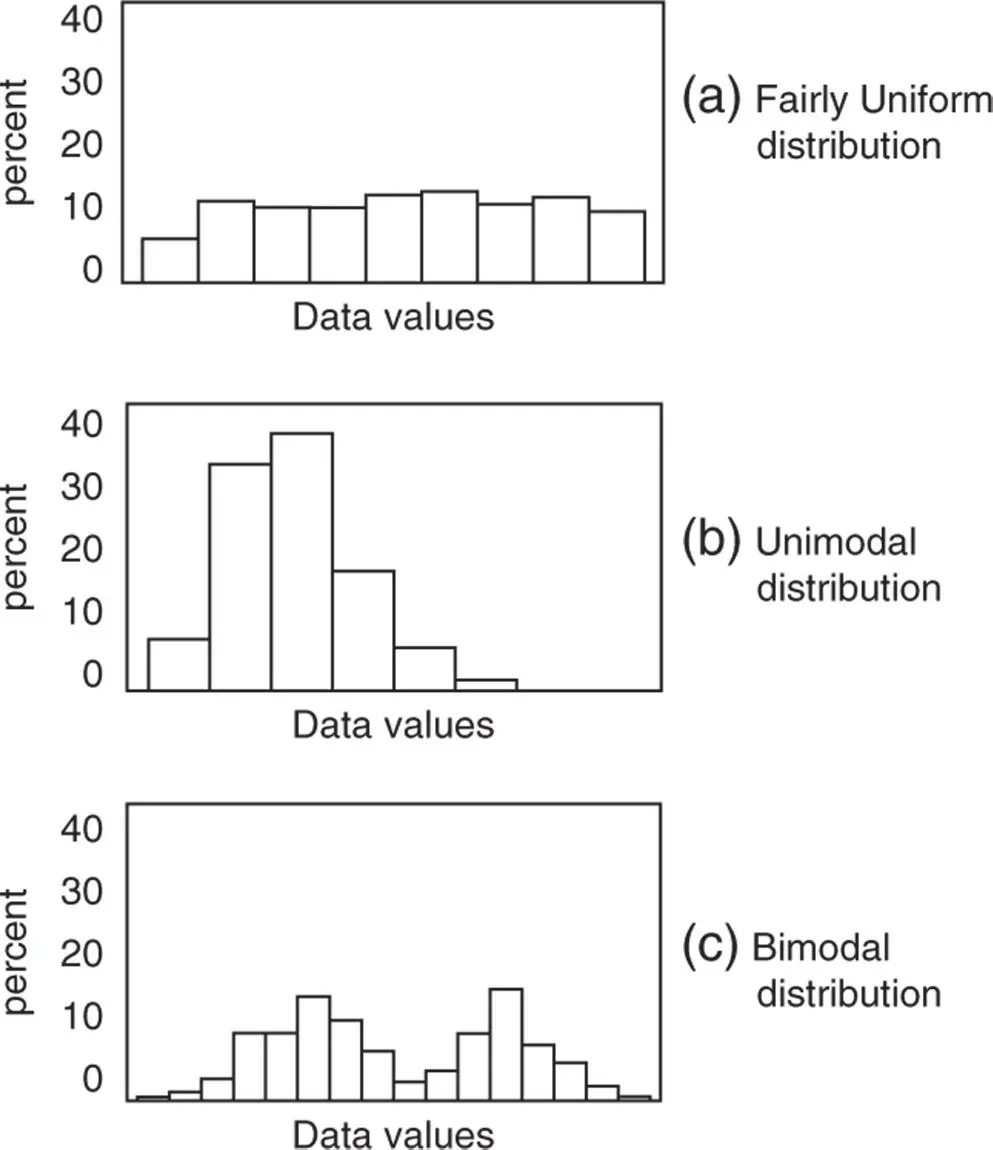
Figure 1.2 Shapes of distributions.
Stat Tool 1.5 Shapes of Data Distributions for Quantitative Variables
Интервал:
Закладка:
Похожие книги на «End-to-end Data Analytics for Product Development»
Представляем Вашему вниманию похожие книги на «End-to-end Data Analytics for Product Development» списком для выбора. Мы отобрали схожую по названию и смыслу литературу в надежде предоставить читателям больше вариантов отыскать новые, интересные, ещё непрочитанные произведения.


Обсуждение, отзывы о книге «End-to-end Data Analytics for Product Development» и просто собственные мнения читателей. Оставьте ваши комментарии, напишите, что Вы думаете о произведении, его смысле или главных героях. Укажите что конкретно понравилось, а что нет, и почему Вы так считаете.