Cole Stryker - Smarter Data Science
Здесь есть возможность читать онлайн «Cole Stryker - Smarter Data Science» — ознакомительный отрывок электронной книги совершенно бесплатно, а после прочтения отрывка купить полную версию. В некоторых случаях можно слушать аудио, скачать через торрент в формате fb2 и присутствует краткое содержание. Жанр: unrecognised, на английском языке. Описание произведения, (предисловие) а так же отзывы посетителей доступны на портале библиотеки ЛибКат.
- Название:Smarter Data Science
- Автор:
- Жанр:
- Год:неизвестен
- ISBN:нет данных
- Рейтинг книги:5 / 5. Голосов: 1
-
Избранное:Добавить в избранное
- Отзывы:
-
Ваша оценка:
Smarter Data Science: краткое содержание, описание и аннотация
Предлагаем к чтению аннотацию, описание, краткое содержание или предисловие (зависит от того, что написал сам автор книги «Smarter Data Science»). Если вы не нашли необходимую информацию о книге — напишите в комментариях, мы постараемся отыскать её.
Data science is emerging as a hands-on tool for not just data scientists, but business professionals as well. Managers, directors, IT leaders, and analysts must expand their use of data science capabilities for the organization to stay competitive.
helps them achieve their enterprise-grade data projects and AI goals. It serves as a guide to building a robust and comprehensive information architecture program that enables sustainable and scalable AI deployments.
When an organization manages its data effectively, its data science program becomes a fully scalable function that’s both prescriptive and repeatable. With an understanding of data science principles, practitioners are also empowered to lead their organizations in establishing and deploying viable AI. They employ the tools of machine learning, deep learning, and AI to extract greater value from data for the benefit of the enterprise.
By following a ladder framework that promotes prescriptive capabilities, organizations can make data science accessible to a range of team members, democratizing data science throughout the organization. Companies that collect, organize, and analyze data can move forward to additional data science achievements:
Improving time-to-value with infused AI models for common use cases Optimizing knowledge work and business processes Utilizing AI-based business intelligence and data visualization Establishing a data topology to support general or highly specialized needs Successfully completing AI projects in a predictable manner Coordinating the use of AI from any compute node. From inner edges to outer edges: cloud, fog, and mist computing When they climb the ladder presented in this book, businesspeople and data scientists alike will be able to improve and foster repeatable capabilities. They will have the knowledge to maximize their AI and data assets for the benefit of their organizations.
Smarter Data Science — читать онлайн ознакомительный отрывок
Ниже представлен текст книги, разбитый по страницам. Система сохранения места последней прочитанной страницы, позволяет с удобством читать онлайн бесплатно книгу «Smarter Data Science», без необходимости каждый раз заново искать на чём Вы остановились. Поставьте закладку, и сможете в любой момент перейти на страницу, на которой закончили чтение.
Интервал:
Закладка:
If a person or a machine had access to a piece of information or an outcome from an AI model, the person or machine could begin a line of inquiry to determine trust. For example, if the person or machine is given a score (representing the interrogative what ), can they then ask, “ How was this information produced? Where was this information produced? Who produced this information? When was this information produced? Is this information appropriate to meet my needs ( why )?”
The Trust Matrix
To help visually grasp how the holistic nature of the six interrogatives can assist in trust and becoming data-driven, the interrogatives can be mapped to a trust matrix (shown in Figure 2-1) as the x-axis. The y-axis reflects the time horizons: past, present, and future.
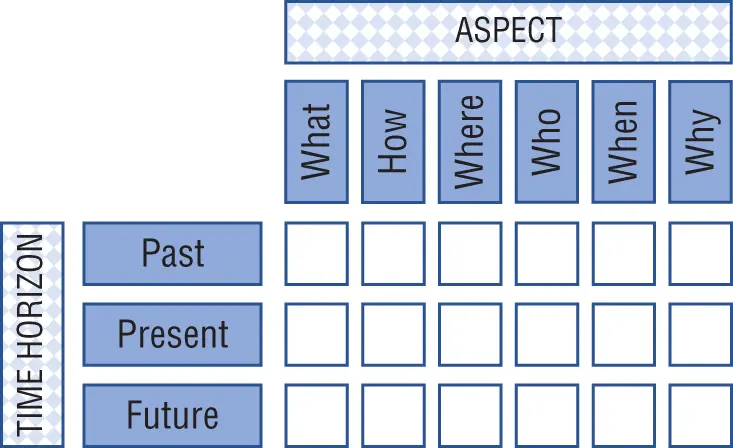
Figure 2-1:Trust matrix
The past represents something that has occurred. The past is a history and can inform as to what happened, what was built, what was bought, what was collected (in terms of money), and so on. The present is about the now and can inform us as to things that are underway or in motion. The present addresses what is happening, what is being built, who is buying, etc. The future is about things to be. We can prepare for the future by planning or forecasting. We can budget, and we can predict.
Revealing the past can yield hindsight, present insight, and future foresight. The spectrum across the time horizons provides the viewpoints for what happened, is happening, and could/will happen. While the divisions are straightforward, the concept of the present can actually span the past and the present. Consider, “this year.” This year is part of the present, but the days gone are also part of the past, and the days to come are also part of the future. Normally, the context of inquiry can help to remove any untoward temporal complications.
At each x-y intersection lies what the organization can reasonably know. What is knowable has two dimensions, as shown in Figure 2-2. The two dimensions are breadth and depth. The breadth is a reflection of scope and represents a means to understand how much is known about a given topic. For example, some organizations may have a retention policy that requires information to be expunged after a given number of years—for example, seven years. In this example, the breadth of information an organization has access to is constrained to the most recent seven years.
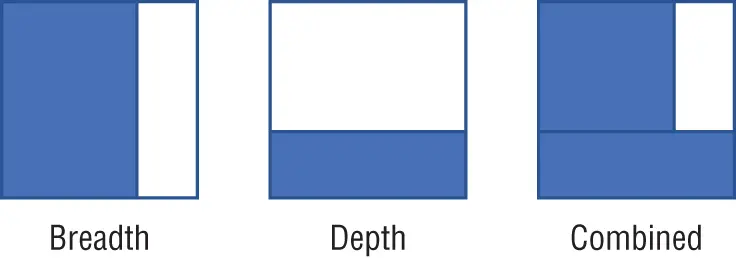
Figure 2-2:Breadth and depth slivers
Conversely, depth is a reflection of detail. The topic of ethnography is addressed here. For example, a person may purchase a product, and if that product is gifted to some other person, the organization may not have any indication as to the actual consumer of the product, representing a lack of depth.
Breadth and depth can be approximated in terms of percentages and mapped to an intersection. Figure 2-2 shows an example where a breadth sliver is shown to be approximately 75%, and a depth sliver is approximately 25%. The third box combines the breadth and depth slivers together.
In Figure 2-3, the quality of the information is graded against the breadth and depth. The diamond grid pattern indicates that the data quality is known to be poor. The diagonal stripes pattern indicates that the data quality is moderate, which means that the information in specific conditions may prove to be unreliable, while the square grid pattern is used to indicate that the information is of high quality and is reliable.
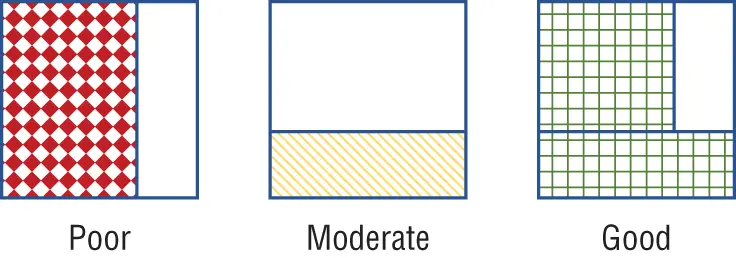
Figure 2-3:Grading
Therefore, even if the breadth and depth are not both 100%, the available data can be graded in the context of the information that is at hand.
Across the overall trust matrix, if the information for a particular need could be measured in terms of breadth and depth for each aspect across each time horizon and then graded, a person or a machine could evaluate an aspect of risk in terms of consuming information. Being able to accurately quantify a risk in terms of how much is known and at what level of detail, an organization can pursue being data-driven with confidence, knowing that all subsequent actions or decisions are being made on the merit of the data.
Furthermore, a data-driven organization using its data as critical evidence to help inform and influence on strategy will need a means to weigh options against any inherent risk. A data-driven organization must develop an evidence-based culture in which data can be evaluated against a means to establish trust and that the analytics and AI performed against the data is deemed to be highly relevant, informative, and useful in determining next steps.
The Importance of Metrics and Human Insight
For organizations that make gut-feel decisions and are apprehensive about pursuing data-driven means, the ability to measure is vital. The ends and means model shown in Chapter 1, “Climbing the AI Ladder,” Figure 1-4 illustrates the necessity to balance what needs to be measured with something that can produce something that is measurable and is aligned to what ultimately needs to be measured.
The use of AI requires an organization to become data-driven, especially when a person is in a decision-making loop. Machine-to-machine communication fosters the ability of a machine to act independently to make decisions based purely on the information at hand. Orchestrating a person into a communication flow allows for decision augmentation and to act as a gatekeeper.
In the 1960s, the euphemism Mad Men was supposedly created by those working in the field of advertising, where—in the United States—the industry was heavily centered around Madison Avenue in New York City (the men of Mad ison Avenue). Mad Men created messages for the masses. Whether messages were regionally appropriate or whether an advertisement resonated exceptionally well with the discrete needs of each singular individual was not the core focus. Eventually, the gut feel of the Mad Men approach gave way to the focus group–oriented view of the Media Men. In turn, the Media Men have given way to the Math Men. The Math Men are the men and women of data science whose provinces are the hordes of big data and thick data, algorithms, and machine learning that derive insight from data. As the new-collar worker expands into all aspects of corporate work from using model-based outcomes, each decision is going to be based on data. New-collar workers are data-driven and so are their decisions.
THE ZACHMAN FRAMEWORK
The six interrogatives—what, how, where, who, when, why—provide a methodical means toward inquiry. However, the use of the interrogatives in the Zachman Framework provide for a structural device in the framework. Because the Zachman Framework is structural in nature and is not a methodology, the framework is actually an ontology for describing the enterprise.
The Zachman Framework is not a methodology because the framework is not prescriptive or anchored on a process. The framework is concerned about creating, operating, or changing essential components that are of interest to an enterprise. The components can be big or small and include the enterprise itself, a department, a cloud, an app, a container, a schema, and an AI model.
Читать дальшеИнтервал:
Закладка:
Похожие книги на «Smarter Data Science»
Представляем Вашему вниманию похожие книги на «Smarter Data Science» списком для выбора. Мы отобрали схожую по названию и смыслу литературу в надежде предоставить читателям больше вариантов отыскать новые, интересные, ещё непрочитанные произведения.

![Роман Зыков - Роман с Data Science. Как монетизировать большие данные [litres]](/books/438007/roman-zykov-roman-s-data-science-kak-monetizirova-thumb.webp)


Обсуждение, отзывы о книге «Smarter Data Science» и просто собственные мнения читателей. Оставьте ваши комментарии, напишите, что Вы думаете о произведении, его смысле или главных героях. Укажите что конкретно понравилось, а что нет, и почему Вы так считаете.