Philippe J. S. De Brouwer - The Big R-Book
Здесь есть возможность читать онлайн «Philippe J. S. De Brouwer - The Big R-Book» — ознакомительный отрывок электронной книги совершенно бесплатно, а после прочтения отрывка купить полную версию. В некоторых случаях можно слушать аудио, скачать через торрент в формате fb2 и присутствует краткое содержание. Жанр: unrecognised, на английском языке. Описание произведения, (предисловие) а так же отзывы посетителей доступны на портале библиотеки ЛибКат.
- Название:The Big R-Book
- Автор:
- Жанр:
- Год:неизвестен
- ISBN:нет данных
- Рейтинг книги:3 / 5. Голосов: 1
-
Избранное:Добавить в избранное
- Отзывы:
-
Ваша оценка:
The Big R-Book: краткое содержание, описание и аннотация
Предлагаем к чтению аннотацию, описание, краткое содержание или предисловие (зависит от того, что написал сам автор книги «The Big R-Book»). Если вы не нашли необходимую информацию о книге — напишите в комментариях, мы постараемся отыскать её.
The Big R-Book for Professionals: From Data Science to Learning Machines and Reporting with R Provides a practical guide for non-experts with a focus on business users Contains a unique combination of topics including an introduction to R, machine learning, mathematical models, data wrangling, and reporting Uses a practical tone and integrates multiple topics in a coherent framework Demystifies the hype around machine learning and AI by enabling readers to understand the provided models and program them in R Shows readers how to visualize results in static and interactive reports Supplementary materials includes PDF slides based on the book’s content, as well as all the extracted R-code and is available to everyone on a Wiley Book Companion Site
is an excellent guide for science technology, engineering, or mathematics students who wish to make a successful transition from the academic world to the professional. It will also appeal to all young data scientists, quantitative analysts, and analytics professionals, as well as those who make mathematical models.
The Big R-Book — читать онлайн ознакомительный отрывок
Ниже представлен текст книги, разбитый по страницам. Система сохранения места последней прочитанной страницы, позволяет с удобством читать онлайн бесплатно книгу «The Big R-Book», без необходимости каждый раз заново искать на чём Вы остановились. Поставьте закладку, и сможете в любой момент перейти на страницу, на которой закончили чтение.
Интервал:
Закладка:
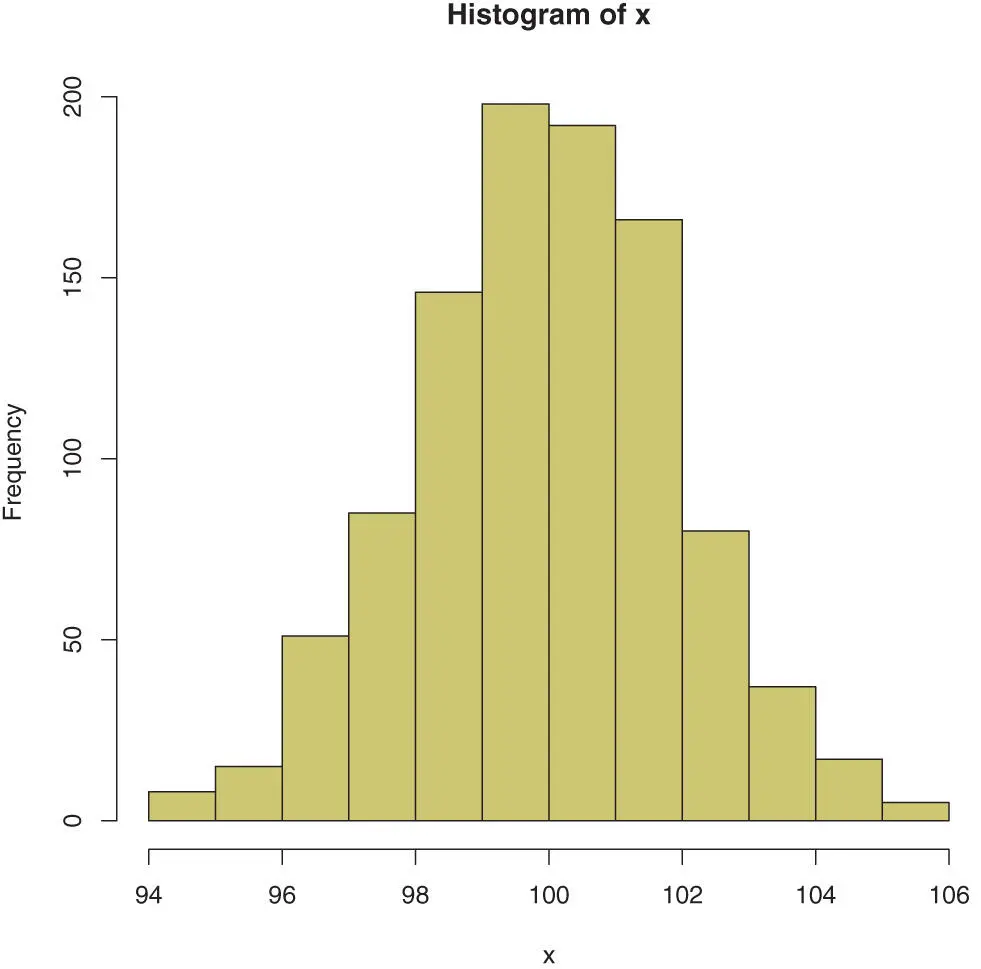
Figure 3.1 : An example showing the histogram of data generated from the normal distribution.
Questions or tasks can be answered by the tools and methods explained previously. Note that it might require to do some research by your own, such as looking into the help files or other documentation (we will of course explain how to access these). If you are using this book to prepare for an exam or test, it is probably a good preparation, but if you are in a hurry it is possible to skip these (in this book they do not add to the material explained). However, in general thinking about the issues presented will help you to solve your data-problems more efficiently.
Note that the answers to most questions can be found in E “Answers to Selected Questions” on page 1061.The answer might not always be detailed but it should be enough to solve the issue raised.
Definition: This is a definition
This is not an book about exact mathematics. This is a pragmatic book with a focus on practical applications. Therefore, we use the word “definition” also in a practical sense.
Definitions are not always rigorous definitions as a mathematician would be used to. We rather use practical definitions (e.g. how a function is implemented).
The use of a function is – mainly at the beginning of the book – highlighted as follows. For example:
Function use for mean()
mean (x, na.rm = FALSE, trim = 0, …)
Where
x is an R-object,
na.rm is a boolean (setting this to TRUE will remove missing values),
trim is the fraction of observations to be removed on both sides of the distribution before the mean is computed – the default is 0 and it cannot be higher than 0.5
From this example, it should be clear how the function mean()is used. Note the following:
The name of the function is in the title.
On the first line we repeat the function with its most important parameters.
The parameter x is an obligatory parameter.
The parameter na.rm can be omitted. When it is not provided, the default FALSE is used. A parameter with a default can be recognised in the first line via the equal sign.
The three dots indicate that other parameters can be passed that will not be used by the function mean(), but they are passed on to further methods.
Some functions can take a lot of parameters. In some cases, we only show the most important ones.
Later on in the book, we assume that the reader is able to use the examples and find more about the function in its documentation. For example, ?meanwill display information about the function mean.
When a new concept or idea is built up with examples they generally appear just like that in the text. Additional examples after the point is made are usually highlighed as follows:
Example: Mean
An example of a function is mean(), as the name suggests it calculates the arithmetic mean (average) of data fed into the function.
# First, generate some data: x <- c(1,2,3) # Then calculate the mean: mean(x) ## [1] 2
Some example environments are split in two parts: the question and the solution as follows:
Example: Mean
What is the mean of all integer numbers from one to 100? Use the function mean().
mean(1:100) ## [1] 50.5
There are a few more special features in the layout that might be of interest.
A hint is something that adds additional practical information that is not part of the normal flow of the text.
 Hint – Using the hint boxes
When first studying a section, skip the hints, and when reading it a second time paymore attention to the hints.
When we want to draw attention to something that might or might not be clear from the normal flow of the text, we put it in a “notice environment.” This looks as follows:
 Note – Layout details
Note that hints, notes and warnings look all similar, but for your convenience, we have differentiating colours and layout details.
There are more such environments and we let them speak for themselves.
Digression – This is good to know
A digression does what you would expect from it. It is not necessary to read in order to understand the rest of the chapter. However, it provides further insight that is useful to gain a deeper insight of the subject discussed.
Skip the digressions when you read the text first, and come back to them later.
 Warning – Read comments in code
When reading the book, always read the comments in the code.
# Code and especially the comments in it are part of # the normal flow of the text!
In general, a warning is important to read once you will start working on your own.
Note – Shadow
Note that the boxes with a shadow are “lifted off the page” and are a little independent from the flow of the main text. Those that are no shadow are part of the main flow of the text (definitions, examples, etc.)
Notes
1 1You, will of course, first have to install the base software R. More about this in Chapter 4“The Basics of R” on page 21.
2 2The number sign, #, is also known as the “hash sign” or “pound sign.” It probably evolved from the “libra ponda” (a pound weight). It is currently used in any different fields as part of phone numbers, in programming languages (e.g. in an URL it indicates a sub-address, in R it precedes a comment, etc), the command prompt for the root user in Unix and Linux, in set theory (#S is the cardinality of the set S), in topology (A#B is the connected sum of manifolds A and B), number theory (#n is the primorial of n), as keyword in some social media, etc. The pronunciation hence varies widely: “hash” when used to tag keywords (#book would be the hash sign and the tag book). Hence, reading the “#”-sign as “hashtag” is at least superfluous). Most often, it is pronounced as “pound.” Note that the musical notation is another symbol, <, that is pronounced as “sharp” as in the music (e.g. C<).
3 3ISO standards refer to the standards published by the International Organization for Standardization (ISO). This is an international standard-defining body, founded on 23 February 1947, it promotes worldwide proprietary, industrial and commercial standards. At this point, 164 countries are member and decisions are made by representatives of those countries. ISO is also recognised by the United Nations.
♣4♣ The Basics of R
In this book we will approach data and analytics from a practitioners point of view and our tool of choice is R. R is in some sense a re-implementation of S – a programming language written in 1976 by John Chambers at Bell Labs – with added lexical scoping semantics. Usually, codewritten in S will also run in R.
Читать дальшеИнтервал:
Закладка:
Похожие книги на «The Big R-Book»
Представляем Вашему вниманию похожие книги на «The Big R-Book» списком для выбора. Мы отобрали схожую по названию и смыслу литературу в надежде предоставить читателям больше вариантов отыскать новые, интересные, ещё непрочитанные произведения.


Обсуждение, отзывы о книге «The Big R-Book» и просто собственные мнения читателей. Оставьте ваши комментарии, напишите, что Вы думаете о произведении, его смысле или главных героях. Укажите что конкретно понравилось, а что нет, и почему Вы так считаете.