Michael Begon - Ecology
Здесь есть возможность читать онлайн «Michael Begon - Ecology» — ознакомительный отрывок электронной книги совершенно бесплатно, а после прочтения отрывка купить полную версию. В некоторых случаях можно слушать аудио, скачать через торрент в формате fb2 и присутствует краткое содержание. Жанр: unrecognised, на английском языке. Описание произведения, (предисловие) а так же отзывы посетителей доступны на портале библиотеки ЛибКат.
- Название:Ecology
- Автор:
- Жанр:
- Год:неизвестен
- ISBN:нет данных
- Рейтинг книги:5 / 5. Голосов: 1
-
Избранное:Добавить в избранное
- Отзывы:
-
Ваша оценка:
Ecology: краткое содержание, описание и аннотация
Предлагаем к чтению аннотацию, описание, краткое содержание или предисловие (зависит от того, что написал сам автор книги «Ecology»). Если вы не нашли необходимую информацию о книге — напишите в комментариях, мы постараемся отыскать её.
– now in full colour – offers students and practitioners a review of the ecological sciences.
The previous editions of this book earned the authors the prestigious ‘Exceptional Life-time Achievement Award’ of the British Ecological Society – the aim for the fifth edition is not only to maintain standards but indeed to enhance its coverage of Ecology.
In the first edition, 34 years ago, it seemed acceptable for ecologists to hold a comfortable, objective, not to say aloof position, from which the ecological communities around us were simply material for which we sought a scientific understanding. Now, we must accept the immediacy of the many environmental problems that threaten us and the responsibility of ecologists to play their full part in addressing these problems. This fifth edition addresses this challenge, with several chapters devoted entirely to applied topics, and examples of how ecological principles have been applied to problems facing us highlighted throughout the remaining nineteen chapters.
Nonetheless, the authors remain wedded to the belief that environmental action can only ever be as sound as the ecological principles on which it is based. Hence, while trying harder than ever to help improve preparedness for addressing the environmental problems of the years ahead, the book remains, in its essence, an exposition of the
of ecology. This new edition incorporates the results from more than a thousand recent studies into a fully up-to-date text.
Written for students of ecology, researchers and practitioners, the fifth edition of
is anessential reference to all aspects of ecology and addresses environmental problems of the future.
Ecology — читать онлайн ознакомительный отрывок
Ниже представлен текст книги, разбитый по страницам. Система сохранения места последней прочитанной страницы, позволяет с удобством читать онлайн бесплатно книгу «Ecology», без необходимости каждый раз заново искать на чём Вы остановились. Поставьте закладку, и сможете в любой момент перейти на страницу, на которой закончили чтение.
Интервал:
Закладка:
Source : After Wallis et al . (2016).
APPLICATION 1.5 Human history and species invasions
In this section on the role of history in the determination of species distributions, it would be misleading only to consider 'natural' historical factors. Human history has had equally profound effects on the distribution of species around the globe. The world has shrunk as travel has boomed and, just like us, animals, plants and microorganisms have become globetrotters, introduced to new locations on purpose or as accidental tourists.
Only about 10% of invaders become established, and of these, about 10% spread and have significant, sometimes disastrous, consequences (Townsend, 2008). The introduction in the 1950s of Nile perch ( Lates niloticus ) to establish a commercial fishery in Lake Victoria in East Africa, for example, is held responsible for the extinction or near‐extinction of several hundred native fish species. An equally striking plant example is provided by the neotropical Parthenium weed ( Parthenium hysterophorus ) that has invaded large areas of a number of continents ( Figure 1.21), generally by accident, and is responsible for the degradation of grasslands and of many cropping and livestock systems. Its success as an invader can be attributed to tolerance of a wide range of physicochemical conditions, escape from natural predators in non‐native regions, high competitiveness against other plants (including the release of allelopathic chemicals into the soil) and high genetic diversity, among other factors (Bajwa et al ., 2016). Finally, prominent among imported human disease organisms are HIV, influenza and zika viruses.
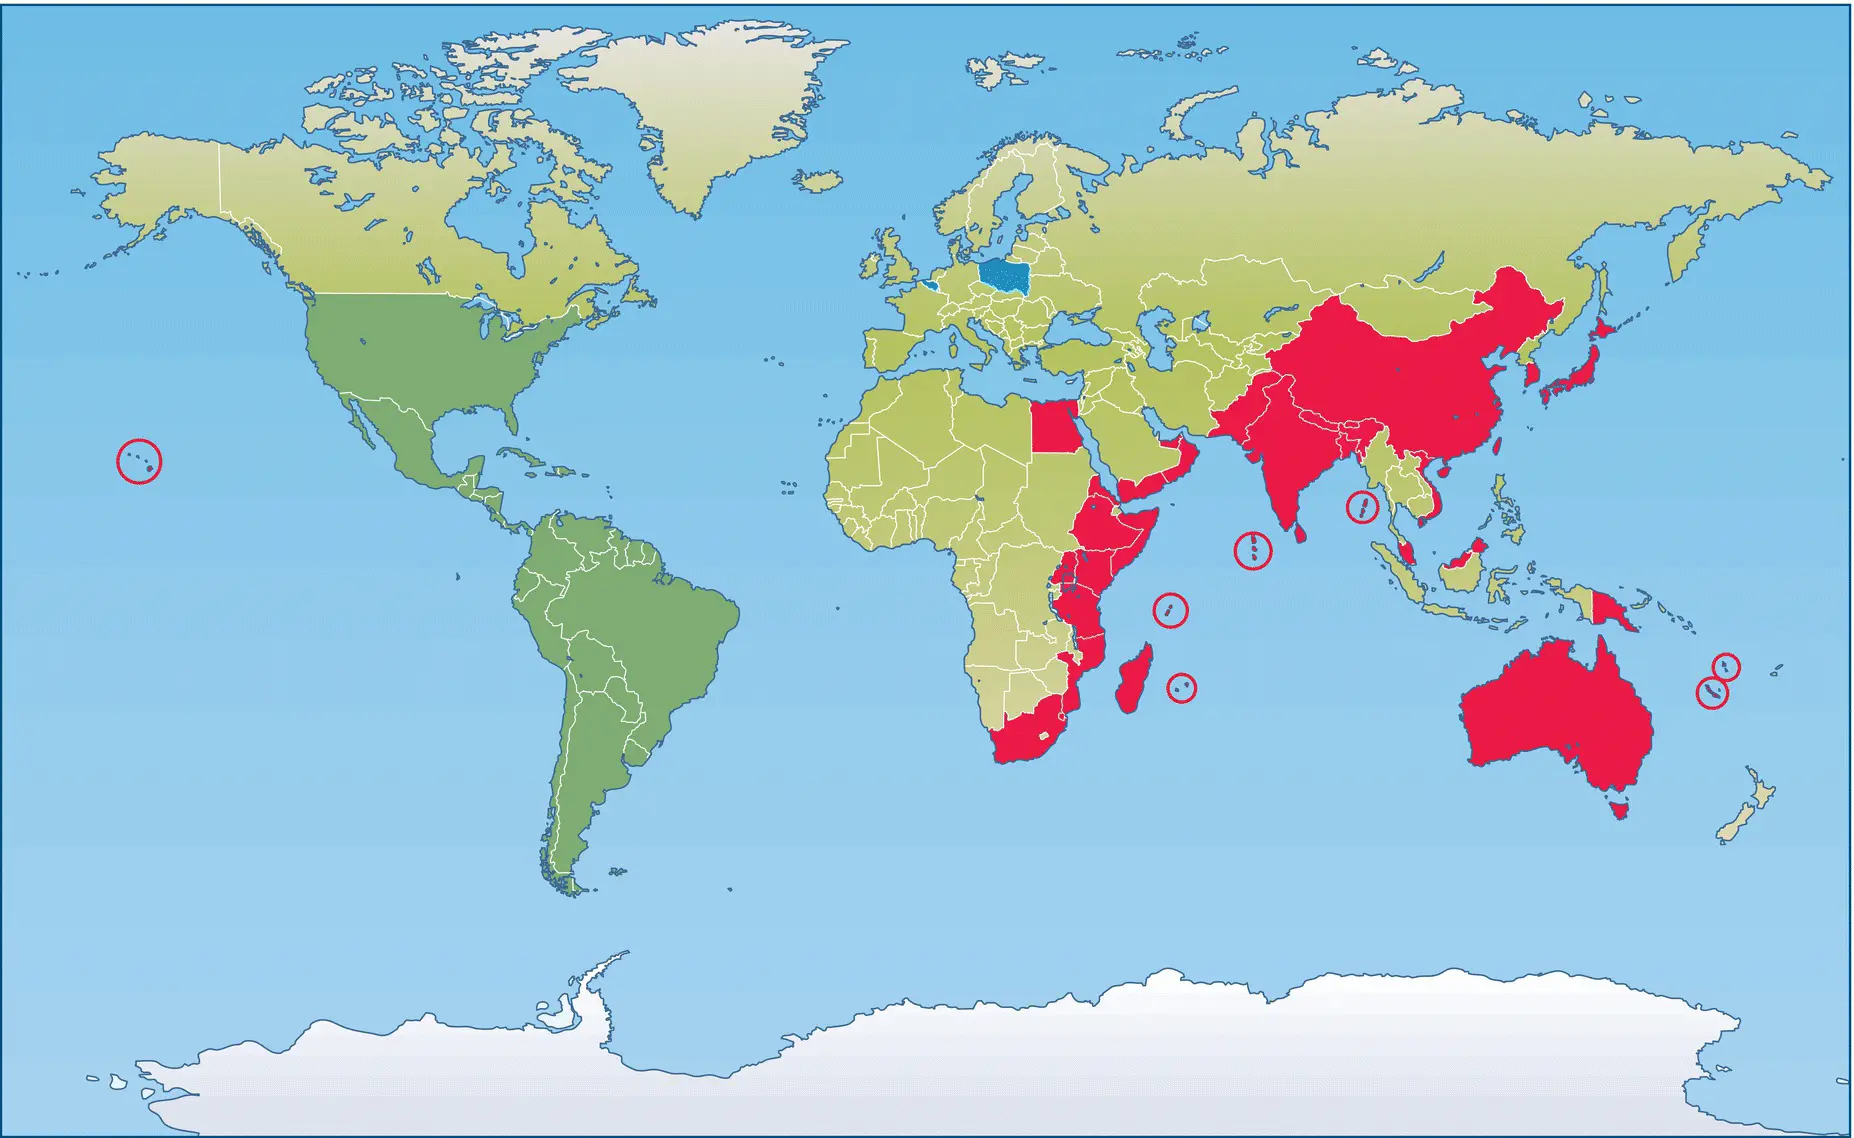
Figure 1.21 The invasion of Parthenium weed.This weed is invasive in the countries shaded or circled in red. Blue‐shaded countries represent populations of the weed that may be establishing in Europe. Countries shaded green are considered to be within its invasive range.
Source : From Bajwa et al . (2016).
homogenisation of the biota
A profound consequence of global transport and past colonialism has been homogenisation of the biota. The same set of human camp followers now occur in widely separated regions – house sparrows, cockroaches, rats and mice, salmonid fish and game animals, domestic animals and crop plants (with their associated pests and diseases) (Townsend, 2008). Because native species often fare badly in the face of this onslaught, many parts of North America and the southern hemisphere now reflect a European legacy more closely than their native heritage. A graphic example of biotic homogenisation is provided at both ends of the trade link between the Great Lakes of North America and the Baltic Sea. Often spread in the ballast water of ships moving along this route, a third of the 170 species of invasive fish, molluscs and crustaceans in the Great Lakes are from the Baltic, and a third of the 100 invaders in the Baltic Sea come from the Great Lakes. Furthermore, enhanced shipping promoted by recent expansions of the Suez and Panama Canals can be expected to escalate marine invasions at regional and continental scales, while increases in internet‐based trade in pets and other exotic organisms is providing novel pathways that will be difficult to regulate (Ricciardi et al ., 2017). We take this case up again in Section 6.6.2.
economic consequences of invasions
Invaders can have far‐reaching economic as well as ecological consequences. Table 1.1categorises the tens of thousands of exotic invaders in the USA into taxonomic groupings and lists these in order of their estimated annual costs (in terms of economic damage done and costs of control). Overall, pests of crop plants, including weeds, insects and pathogens are the most expensive, with rats some way behind but responsible for the destruction of stored grains, starting fires by gnawing through electrical wires, polluting foodstuffs, spreading diseases and preying on native animals. Imported human disease organisms are also very expensive to treat and result in 40 000 deaths per year. Ecological knowledge is needed to predict future invasions that are likely to have damaging consequences so that the invaders can be confronted, particularly via biosecurity at national borders. Despite their obvious deleterious effects, the importance of biological invasions seems not to be well understood by the public or fully accepted by decision makers (Courchamp et al ., 2017). Ecologists have much to contribute in this arena.
Table 1.1 Estimated annual costs (billions of US dollars) associated with damage caused and management costs of invaders in the USA.Taxonomic groupings are ordered in terms of the total costs associated with them. Source : After Pimentel et al . (2000).
| Type of organism | Number of invaders | Major culprits | Loss and damage | Control costs | Total costs |
|---|---|---|---|---|---|
| Microbes (pathogens) | >20 000 | Crop pathogens | 32.1 | 9.1 | 41.2 |
| Mammals | 20 | Rats and cats | 37.2 | Na | 37.2 |
| Plants | 5 000 | Crop weeds | 24.4 | 9.7 | 34.1 |
| Arthropods | 4 500 | Crop pests | 17.6 | 2.4 | 20.0 |
| Birds | 97 | Pigeons | 1.9 | NA | 1.9 |
| Molluscs | 88 | Asian clams, zebra mussels | 1.2 | 0.1 | 1.3 |
| Fishes | 138 | Grass carp, etc. | 1.0 | NA | 1.0 |
| Reptiles, amphibians | 53 | Brown tree snake | 0.001 | 0.005 | 0.006 |
NA, data not available
1.5 The match between communities and their environments
1.5.1 Terrestrial biomes of the earth
Before we examine the differences and similarities between communities, we need to consider the larger groupings, ‘biomes’, in which biogeographers recognise marked differences in the flora and fauna of different parts of the world. The number of terrestrial biomes that are distinguished is a matter of taste. They certainly grade into one another, and sharp boundaries are a convenience for cartographers rather than a reality of nature. We describe eight terrestrial biomes and illustrate their global distribution in Figure 1.22, and show how they may be related to annual temperature and precipitation ( Figure 1.23). Apart from anything else, understanding the terminology that describes and distinguishes these biomes is necessary when we come to consider key questions later in the book. Why are there more species in some communities than in others? Are some communities more stable in their composition than others, and if so why? Do more productive environments support more diverse communities? Or do more diverse communities make more productive use of the resources available to them?
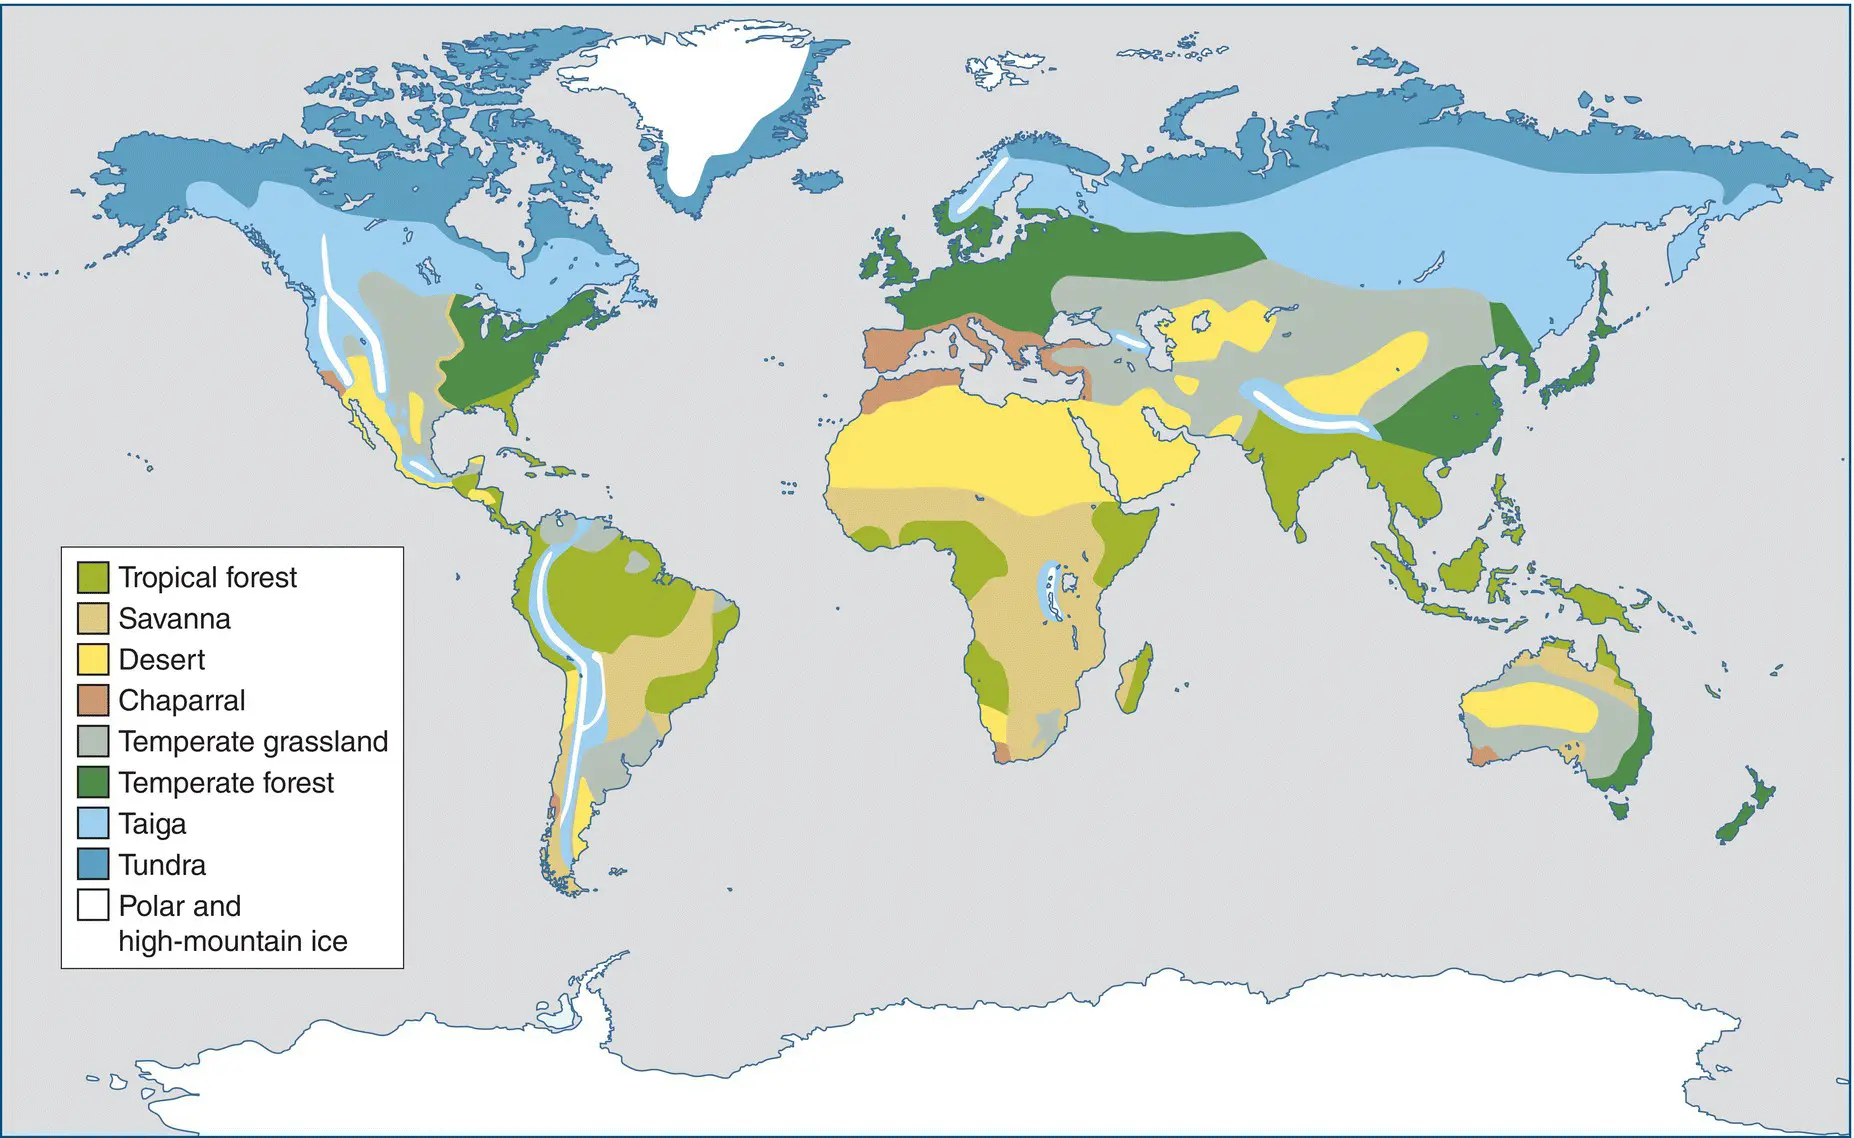
Figure 1.22 World distribution of the major biomes of vegetation.
Source : From http://www.zo.utexas.edu/faculty/sjasper/images/50.24.gif.
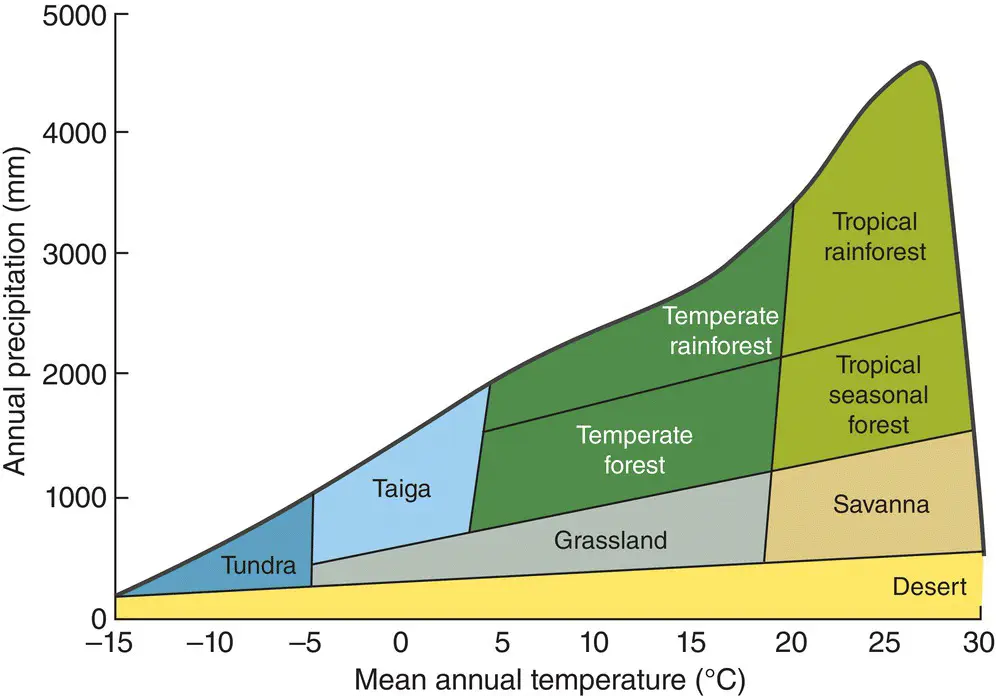
Figure 1.23 Biomes in relation to rainfall and temperature.The variety of environmental conditions experienced in terrestrial biomes can be described in terms of their annual rainfall and mean annual temperatures.
Читать дальшеИнтервал:
Закладка:
Похожие книги на «Ecology»
Представляем Вашему вниманию похожие книги на «Ecology» списком для выбора. Мы отобрали схожую по названию и смыслу литературу в надежде предоставить читателям больше вариантов отыскать новые, интересные, ещё непрочитанные произведения.


Обсуждение, отзывы о книге «Ecology» и просто собственные мнения читателей. Оставьте ваши комментарии, напишите, что Вы думаете о произведении, его смысле или главных героях. Укажите что конкретно понравилось, а что нет, и почему Вы так считаете.