David Machin - Medical Statistics
Здесь есть возможность читать онлайн «David Machin - Medical Statistics» — ознакомительный отрывок электронной книги совершенно бесплатно, а после прочтения отрывка купить полную версию. В некоторых случаях можно слушать аудио, скачать через торрент в формате fb2 и присутствует краткое содержание. Жанр: unrecognised, на английском языке. Описание произведения, (предисловие) а так же отзывы посетителей доступны на портале библиотеки ЛибКат.
- Название:Medical Statistics
- Автор:
- Жанр:
- Год:неизвестен
- ISBN:нет данных
- Рейтинг книги:3 / 5. Голосов: 1
-
Избранное:Добавить в избранное
- Отзывы:
-
Ваша оценка:
Medical Statistics: краткое содержание, описание и аннотация
Предлагаем к чтению аннотацию, описание, краткое содержание или предисловие (зависит от того, что написал сам автор книги «Medical Statistics»). Если вы не нашли необходимую информацию о книге — напишите в комментариях, мы постараемся отыскать её.
Helpful multi-choice exercises are included at the end of each chapter, with answers provided at the end of the book. Each analysis technique is carefully explained and the mathematics kept to minimum. Written in a style suitable for statisticians and clinicians alike, this edition features many real and original examples, taken from the authors' combined many years' experience of designing and analysing clinical trials and teaching statistics.
Students of the health sciences, such as medicine, nursing, dentistry, physiotherapy, occupational therapy, and radiography should find the book useful, with examples relevant to their disciplines. The aim of training courses in medical statistics pertinent to these areas is not to turn the students into medical statisticians but rather to help them interpret the published scientific literature and appreciate how to design studies and analyse data arising from their own projects. However, the reader who is about to design their own study and collect, analyse and report on their own data will benefit from a clearly written book on the subject which provides practical guidance to such issues.
The practical guidance provided by this book will be of use to professionals working in and/or managing clinical trials, in academic, public health, government and industry settings, particularly medical statisticians, clinicians, trial co-ordinators. Its practical approach will appeal to applied statisticians and biomedical researchers, in particular those in the biopharmaceutical industry, medical and public health organisations.
Medical Statistics — читать онлайн ознакомительный отрывок
Ниже представлен текст книги, разбитый по страницам. Система сохранения места последней прочитанной страницы, позволяет с удобством читать онлайн бесплатно книгу «Medical Statistics», без необходимости каждый раз заново искать на чём Вы остановились. Поставьте закладку, и сможете в любой момент перейти на страницу, на которой закончили чтение.
Интервал:
Закладка:
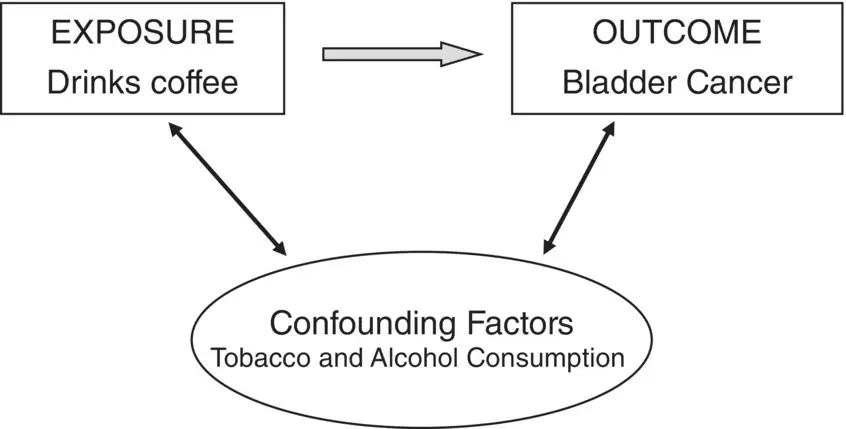
Figure 1.1 Graphical representation of how confounding variables may influence both exposure (drinking coffee) and bladder cancer incidence.
Any observational study that compares populations distinguished by a particular variable (such as a comparison of coffee drinkers and non‐coffee drinkers) and ascribes the differences found in other variables (such as bladder cancer rates) to the first variable is open to the charge that the observed differences are in fact due to some other, confounding, variables. Thus, the difference in bladder cancer rates between coffee drinkers and non‐drinkers has been ascribed to genetic factors; that is, some factor that makes people want to drink coffee also makes them more susceptible bladder cancer. The difficulty with observational studies is that there is an infinite source of potential confounding variables. An investigator can measure all the variables that seem reasonable to him but a critic can always think of another, unmeasured, variable that just might explain the result. It is only in prospective randomised studies that this logical difficulty is avoided. In randomised trials, where the alternative interventions (the exposure variables) are assigned purely by a chance mechanism, it can be assumed that unmeasured confounding variables are comparable, on average, in the two groups. Unfortunately, in many circumstances it is not possible to randomise the exposure variable as part of the experimental design, as in the case of drinking coffee and bladder cancer, and so alternative interpretations are always possible. Observational studies are further discussed in Chapter 14.
1.4 How a Statistician Can Help
Statistical ideas relevant to good design and analysis are not easy and we would always advise an investigator to seek the advice of a statistician at an early stage of an investigation. Here are some ways the medical statistician might help.
Sample Size and Power Considerations
One of the commonest questions asked of a consulting statistician is: how large should my study be? If the investigator has a reasonable amount of knowledge as to the likely outcome of a study, and potentially large resources of finance and time, then the statistician has tools available to enable a scientific answer to be made to the question. However, the usual scenario is that the investigator has either a research grant of a limited size, or limited time, or a limited pool of patients. Nevertheless, given certain assumptions the medical statistician is still able to help. For a given number of patients, the probability of obtaining effects of a certain size can be calculated. If the outcome variable is simply success or failure, the statistician will need to know the anticipated percentage of successes in each group so that the difference between them can be judged of potential clinical relevance. If the outcome variable is a quantitative measurement, the statistician will need to know the size of the difference between the two groups, and the expected variability of the measurement. For example, in a survey to see if patients with diabetes have raised blood pressure the medical statistician might say ‘with 100 diabetics and 100 healthy subjects in this survey and a possible difference in blood pressure of 5 mmHg, with standard deviation 10 mmHg, you have a 20% chance of obtaining a statistically significant result at the 5% level’. (The term ‘statistically significant’ will be explained in Chapter 6.) This statement means that one would anticipate that in only one study in five (20%) of the proposed size would a statistically significant result be obtained. The investigator would then have to decide whether it was sensible or ethical to conduct a survey with such a small probability of success. One option would be to increase the size of the survey until success (defined as a statistically significant result if a difference of 5 mmHg or more does truly exist) becomes more probable.
Questionnaires
Rigby et al. (2004), in their survey of original articles in three UK general practice journals, found that the most common design was that of a cross‐sectional or questionnaire survey, with approximately one third of the articles classified as such.
For all but the smallest data sets it is desirable to use a computer for statistical analysis. The responses to a questionnaire will need to be easily coded for computer analysis and a medical statistician may be able to help with this. It is important to ask for help at an early stage so that the questionnaire can be piloted and modified before use in a study. Further details on questionnaire design and surveys are given in Chapter 14.
Choice of Sample and of Control Subjects
The question of whether one has a representative sample is a typical problem faced by statisticians. For example, it used to be believed that migraine was associated with intelligence, perhaps on the grounds that people who used their brains were more likely to get headaches, but a subsequent population study failed to reveal any social class gradient and, by implication, any association with intelligence. The fallacy arose, perhaps, because intelligent people were more likely than the less intelligent to consult their physician about migraine.
In many studies an investigator will wish to compare patients suffering from a certain disease with healthy (control) subjects. The choice of the appropriate control population is crucial to a correct interpretation of the results. This is discussed further in Chapter 14.
Design of Study
It has been emphasised that design deserves as much consideration as analysis, and a statistician can provide advice on design. In a clinical trial, for example, what is known as a double‐blind randomised design is nearly always preferable (see Chapter 15), but not always achievable. If the treatment is an intervention, such as a surgical procedure, it might be impossible to prevent individuals knowing which treatment they are receiving but it should be possible to shield their assessors from knowing. We also discuss methods of randomisation and other design issues in Chapter 15.
Laboratory Experiments
Medical investigators often appreciate the effect that biological variation has in patients, but overlook or underestimate its presence in the laboratory. In dose–response studies, for example, it is important to assign treatment at random, whether the experimental units are humans, animals or test tubes. A statistician can also advise on quality control of routine laboratory measurements and the measurement of within‐ and between‐observer variation.
Displaying Data
A well‐chosen figure or graph can summarise the results of a study very concisely. A statistician can help by advising on the best methods of displaying data. For example, when plotting histograms, choice of the group interval can affect the shape of the plotted distribution; with too wide an interval important features of the data will be obscured; too narrow an interval and random variation in the data may distract attention from the shape of the underlying distribution. Advice on displaying data is given in Chapter 2.
Choice of Summary Statistics and Statistical Analysis
The summary statistics used and the analysis undertaken must reflect the basic design of the study and the nature of the data. In some situations, for example, a median is a better measure of location than a mean. (These terms are defined in Chapter 2.) In a matched study, it is important to produce an estimate of the difference between matched pairs, and an estimate of the reliability of that difference. For example, in a study to examine blood pressure measured in a seated patient compared with that measured when he or she is lying down, it is insufficient simply to report statistics for seated and lying positions separately. The important statistic is the change in blood pressure as the patient changes position and it is the mean and variability of this difference that we are interested in. This is further discussed in Chapter 7. A statistician can advise on the choice of summary statistics, the type of analysis and the presentation of the results.
Читать дальшеИнтервал:
Закладка:
Похожие книги на «Medical Statistics»
Представляем Вашему вниманию похожие книги на «Medical Statistics» списком для выбора. Мы отобрали схожую по названию и смыслу литературу в надежде предоставить читателям больше вариантов отыскать новые, интересные, ещё непрочитанные произведения.


Обсуждение, отзывы о книге «Medical Statistics» и просто собственные мнения читателей. Оставьте ваши комментарии, напишите, что Вы думаете о произведении, его смысле или главных героях. Укажите что конкретно понравилось, а что нет, и почему Вы так считаете.