Sustainable Development Practices Using Geoinformatics
Здесь есть возможность читать онлайн «Sustainable Development Practices Using Geoinformatics» — ознакомительный отрывок электронной книги совершенно бесплатно, а после прочтения отрывка купить полную версию. В некоторых случаях можно слушать аудио, скачать через торрент в формате fb2 и присутствует краткое содержание. Жанр: unrecognised, на английском языке. Описание произведения, (предисловие) а так же отзывы посетителей доступны на портале библиотеки ЛибКат.
- Название:Sustainable Development Practices Using Geoinformatics
- Автор:
- Жанр:
- Год:неизвестен
- ISBN:нет данных
- Рейтинг книги:4 / 5. Голосов: 1
-
Избранное:Добавить в избранное
- Отзывы:
-
Ваша оценка:
Sustainable Development Practices Using Geoinformatics: краткое содержание, описание и аннотация
Предлагаем к чтению аннотацию, описание, краткое содержание или предисловие (зависит от того, что написал сам автор книги «Sustainable Development Practices Using Geoinformatics»). Если вы не нашли необходимую информацию о книге — напишите в комментариях, мы постараемся отыскать её.
Geoinformatics, including Remote Sensing (RS), Geographical Information System (GIS), and Global Positioning System (GPS), is a groundbreaking and advanced technology for acquiring information required for natural resource management and addressing the concerns related to sustainable development. It offers a powerful and proficient tool for mapping, monitoring, modeling, and management of natural resources. There is, however, a lack of studies in understanding the core science and research elements of geoinformatics, as well as larger issues of scaling to use geoinformatics in sustainable development and management practices of natural resources. There is also a fundamental gap between the theoretical concepts and the operational use of these advance techniques.
“Sustainable Development Practices Using Geoinformatics”
Sustainable Development Practices Using Geoinformatics — читать онлайн ознакомительный отрывок
Ниже представлен текст книги, разбитый по страницам. Система сохранения места последней прочитанной страницы, позволяет с удобством читать онлайн бесплатно книгу «Sustainable Development Practices Using Geoinformatics», без необходимости каждый раз заново искать на чём Вы остановились. Поставьте закладку, и сможете в любой момент перейти на страницу, на которой закончили чтение.
Интервал:
Закладка:
2.4.2.2 Total Worker
TW is defined as the number of all types of workers in the total population per sq km. Farming is the largest private-sector enterprise in India, where nearly 58.9% of the workers depend upon agriculture for their income and livelihood [33]. In the coal mining region, along with agriculture, various workers are also involved in mining or industrial activity (quarrying, transportation, blasting, etc.) for daily wages. These workers have direct interaction with the coal product (coal blocks, coal powder, coke, etc.) or wastes (mine spoils, coal ash, dust particles, etc.) causing serious impacts on their health. In the study area, Saunda, Patratu, Lapanga, Jainagar, Sirka, Dari, Labga, Koto, Terpa, etc., are the villages having a higher worker population (>252 workers/km 2) ( Figure 2.5b).
2.4.2.3 Children Age Group (0–6 years) (CAG)
The children in the age group 0–6 years are directly affected by hazards due to their negligible coping capabilities for survival during and post-disaster events. Saunda, Patratu Chaingara, and Sirka are the villages that have a higher number of children below ages (0–6) years (1,983–12,526 children/ villages) ( Figure 2.5c). Close proximity to the coal mining area tendering children more vulnerable to diseases due to polluted air and water of the region. Water bodies associated with abandoned coal mines are the breeding ground for mosquitoes making children more vulnerable to malaria and other diseases in the area.
2.4.2.4 Literacy Rate
The LR represents the number of literate persons in an area. It helps residents to understand the nature of the hazard, its severity, and their response to information issued by disaster management authorities after an event struck. Therefore, areas with a high percentage of literates can be treated as a region with higher copping ability. These regions are assigned the lowest rating, whereas villages with the lowest LR are assigned a higher rating. The villages having LR >45% in the study area are Churchu, Patratu, Saunda, Sirka, Dari, Koto, Urimari, etc. ( Figure 2.5d). Whereas, villages having lowest LR are Tokisud, Aswa, Potanga, Bicha, Chito, Jumara, Kori, etc. ( Figure 2.5d).
2.4.3 Geo-Environmental Hazard and Socio-Economic Vulnerability Assessment
Coal mining hazard and SVI maps were developed using the above-mentioned models ( Equation 2.1and 2.2). The prepared raster layers of different parameters with their respective weights are added and divided by the number of parameters using the raster calculator tool of ArcGIS. The computed geo-environmental hazard and socio-economic vulnerability maps indicated the areas which are more prone to hazard and vulnerability ( Figures 2.6and 2.7).
2.4.3.1 Geo-Environmental Hazard Index
The geo-environmental hazard map was derived by combining AOT, PWV, temperature, and LU/LC of the study area. The computed hazard index indicates the areas, which are more prone to be hazardous ( Figure 2.6). The range of index values for the geo-environmental hazard model (that uses four hazard parameters) is 3–13. Natural Breaks (Jenks) classification technique was used to divide the ranges into four zones such as low (3–5), moderate (5–7), high (7–9), and very high (9–13).
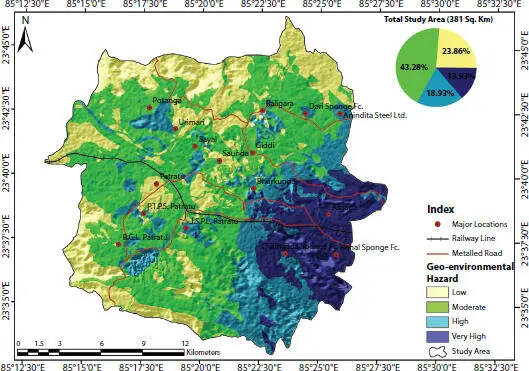
Figure 2.6 Composite geo-environmental hazard index map of the study area.
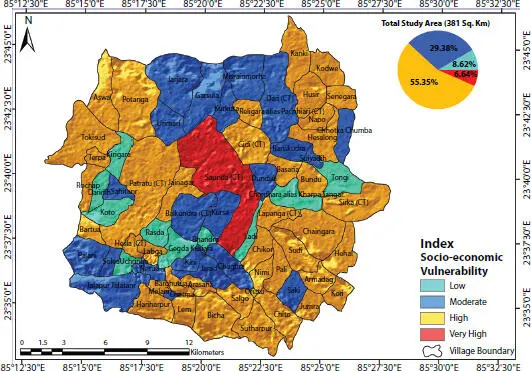
Figure 2.7 Composite socio-economic vulnerability index map of the study area.
The geo-environmental hazard map shows that about 13.93% and 18.93% of the area lie between very high and high hazardous zones and the remaining 43.28% and 23.86% of the area fall in the moderate to low hazardous zone ( Table 2.2). The highly hazardous zones are present in the eastern and south-eastern parts covering an area of 125.27 km 2( Figure 2.6). A possible reason for highly hazardous prone regions is that they were attributed greater AOT and PWV concentration along with location of active coal mining and several sponge iron industries. The majority of the study area lies in the moderate hazardous zone (164.85 km 2) that is in the central part of the region, whereas the lowest hazardous areas are mostly the forest and hilly areas (90.88 km 2).
Table 2.2 Area statistics of socio-economic vulnerability index in study area.
| Socio-economic Vulnerability Zones | Area (km2) | % Area |
|---|---|---|
| Low | 32.84 | 8.62 |
| Moderate | 111.95 | 29.38 |
| High | 210.89 | 55.35 |
| Very High | 25.33 | 6.64 |
| Total | 381.00 | 100.00 |
2.4.3.2 Socio-Economic Vulnerability Index
A composite socio-economic vulnerability map was generated by integrating various village level socio-economic indicators such as PD, TW, children below ages (0–6) and LR in the study area ( Figure 2.7). The ranges of index value of the socio-economic vulnerability model are 3–10 classified in four classes, low (3–4), moderate (4–5), high (5–8), and very high (8–10), respectively.
Maximum SVI villages in the study area lie in a highly vulnerable zones that comprises 210.89 km 2(55.35%) area, whereas 25.33 km 2(8.62%) areas lie in the lowest vulnerable zone ( Table 2.3). The village Saunda is in a very high vulnerable zone due to a higher density of socio-economic indicators such as PD, workers and children below ages (0–6).
2.4.4 CMRI Assessment
Risk assessment is defined as a probability of harmful consequences or expected losses based on interactions between hazards and vulnerable conditions [20, 21, 28]. Therefore, risk assessment in an area considers a combination of hazards and vulnerabilities. Similar to other risk assessments, coal mining-related risk also depends on a combination of various hazard parameters and their interaction with a population. Hence, it is essential to investigate the severity, and spatial extent of these hazards as well as the socio-economic ability of the region to anticipate and cope with the dangers.
Table 2.3 Area statistics of geo-environmental hazard index in study area.
| Geo-environmental Hazard Zones | Area (km2) | % Area |
|---|---|---|
| Low | 90.88 | 23.86 |
| Moderate | 164.85 | 43.28 |
| High | 72.11 | 18.93 |
| Very High | 53.16 | 13.93 |
| Total | 381.00 | 100.00 |
In the present study, the geo-environmental hazard map derived by integration of different hazard parameters along with the socio-economic vulnerability map is used to deduce the coal mining risk pattern at village level ( Equation 2.3). The index value of the output model varies from 15 to 100 in the study area. These index values were further classified using natural breaks (Jenks) classification method in ArcGIS as 15–32 (low), 32–45 (moderate), 45–63 (high), and 63–100 (very high) categories that represent various risk zones ( Table 2.4and Figure 2.8). The results of the study revealed that 133.16 km 2(34.97%) of the study area exhibit low risk zone and is located in the northern, western, and south-west regions. The villages represented in this category are Dari, Kodwe, Palani Talapur, Koto, etc. The moderate risk zone is scattered all over the study area comprising 125.68 km 2(33.01%). The major villages in this categories are Tongi, Chumba, Dari, Kanki, etc. ( Table 2.4). Major urban settlements and villages situated near mining and industries, such as Sirka, Saunda, Hehal, Chaingara, Lapanga, and Patratu are in the high (78.96 km 2; 20.68%) to very high (43.20 km 2; 11.35%) risk zones.
Читать дальшеИнтервал:
Закладка:
Похожие книги на «Sustainable Development Practices Using Geoinformatics»
Представляем Вашему вниманию похожие книги на «Sustainable Development Practices Using Geoinformatics» списком для выбора. Мы отобрали схожую по названию и смыслу литературу в надежде предоставить читателям больше вариантов отыскать новые, интересные, ещё непрочитанные произведения.


Обсуждение, отзывы о книге «Sustainable Development Practices Using Geoinformatics» и просто собственные мнения читателей. Оставьте ваши комментарии, напишите, что Вы думаете о произведении, его смысле или главных героях. Укажите что конкретно понравилось, а что нет, и почему Вы так считаете.