Sustainable Development Practices Using Geoinformatics
Здесь есть возможность читать онлайн «Sustainable Development Practices Using Geoinformatics» — ознакомительный отрывок электронной книги совершенно бесплатно, а после прочтения отрывка купить полную версию. В некоторых случаях можно слушать аудио, скачать через торрент в формате fb2 и присутствует краткое содержание. Жанр: unrecognised, на английском языке. Описание произведения, (предисловие) а так же отзывы посетителей доступны на портале библиотеки ЛибКат.
- Название:Sustainable Development Practices Using Geoinformatics
- Автор:
- Жанр:
- Год:неизвестен
- ISBN:нет данных
- Рейтинг книги:4 / 5. Голосов: 1
-
Избранное:Добавить в избранное
- Отзывы:
-
Ваша оценка:
Sustainable Development Practices Using Geoinformatics: краткое содержание, описание и аннотация
Предлагаем к чтению аннотацию, описание, краткое содержание или предисловие (зависит от того, что написал сам автор книги «Sustainable Development Practices Using Geoinformatics»). Если вы не нашли необходимую информацию о книге — напишите в комментариях, мы постараемся отыскать её.
Geoinformatics, including Remote Sensing (RS), Geographical Information System (GIS), and Global Positioning System (GPS), is a groundbreaking and advanced technology for acquiring information required for natural resource management and addressing the concerns related to sustainable development. It offers a powerful and proficient tool for mapping, monitoring, modeling, and management of natural resources. There is, however, a lack of studies in understanding the core science and research elements of geoinformatics, as well as larger issues of scaling to use geoinformatics in sustainable development and management practices of natural resources. There is also a fundamental gap between the theoretical concepts and the operational use of these advance techniques.
“Sustainable Development Practices Using Geoinformatics”
Sustainable Development Practices Using Geoinformatics — читать онлайн ознакомительный отрывок
Ниже представлен текст книги, разбитый по страницам. Система сохранения места последней прочитанной страницы, позволяет с удобством читать онлайн бесплатно книгу «Sustainable Development Practices Using Geoinformatics», без необходимости каждый раз заново искать на чём Вы остановились. Поставьте закладку, и сможете в любой момент перейти на страницу, на которой закончили чтение.
Интервал:
Закладка:
2.4 Result and Discussion
2.4.1 Thematic Layers of GHI
2.4.1.1 AOT, PWV, and Temperature
The ground-based concentration of AOT, PWV, and temperature were simultaneously measured at 41 locations using the MICROTOPS-II Sunphotometer instrument during January 2011. Further, measured datasets were spatially analyzed using GIS to identify the geo-environmental condition of the study area ( Figures 2.3a–c).
An aerosol is one of the primary pollutants that affect air quality in urban as well as the rural environment of the world [29]. Various coal mining activities such as mine fire, overburden dumping, transportation, and other anthropogenic activity are responsible for increasing these types of pollutants in the atmosphere. The spatial distribution map of AOT(340 nm) indicates a higher concentration (>1.5) over industrial areas (Bhurkunda, Chaingada, Jindal Steel and Patratu thermal power station) followed by active mining regions (Potonga, Railgada, Sayal, Giddi-C, and Bhurkunda colliery). Higher frequency of transportation activities, loading/unloading of coal, smoke emissions from power plants, and sponge iron factories are the primary cause for dispersion of dust particles into the atmosphere in the area ( Figure 2.3d). Whereas AOT is lower in the residential and vegetation areas (<0.6). The range of aerosol concentration in the study area is between 0.46 and 2.42 ( Figure 2.3a).
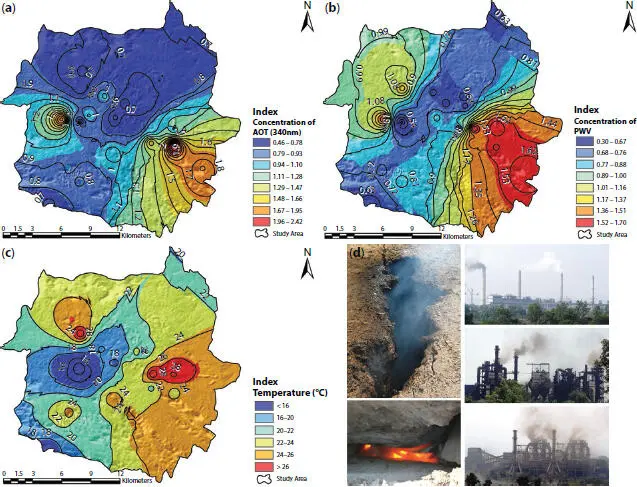
Figure 2.3 Map showing spatial distribution of (a) AOT at wavelength of 340nm, (b) PWV, (c) temperature, (d) field photographs showing emissions of gases from various sources.
Water vapor has a significant relationship between various components of the hydrological cycle. The PWV is an important parameter of water vapor, which is a measure of the total water vapor contained in a small vertical column extending from the ground surface to the top of the atmosphere. However, the majority of moisture in the atmosphere is contained approximately within the lowest 10,000 ft. Distribution of PWV is a good indicator of the dynamics of circulation systems in the atmosphere. It is also an imperative physical parameter for characterizing the optical properties of atmospheric aerosols that influence the global radiation budget and climate change. At present, PWV is also measured using MICROTOPS-II Sunphotometer of solar intensity at 936 and 1,020 nm. The PWV in the study area exhibits a range of 0.3 to 1.7 cm ( Figure 2.3b). It shows variation with high values in industrial areas and low values in forest areas. The high value in industrial areas shows that the humidity near industrial areas is higher as compared to the coal mining, forest, and urban areas.
Surface temperature is also playing a major role in increasing AOT in the atmosphere. During day time, temperature over the study area in the winter season varies between 12.3°C and 29.5°C ( Figure 2.3c). There are some surface mine fires present in this region, which is responsible for increasing the average temperature of the area ( Figure 2.3d). The present study revealed that the temperature is found to be higher in the vicinity of industrial areas as compared to the mining, urban, and forest area ( Figure 2.3c).
2.4.1.2 Land Use/Land Cover
LU/LC is an important indicator of global environmental change that indicates the influence of human activities on the physical environment [30]. Land use (LU) refers to various anthropogenic activities and practices on land, whereas land cover (LC) measures natural vegetation, water-bodies, rock/soil, and natural cover [6]. LU/LC changes have become a central component in current strategies for managing natural resources and monitoring environmental changes.
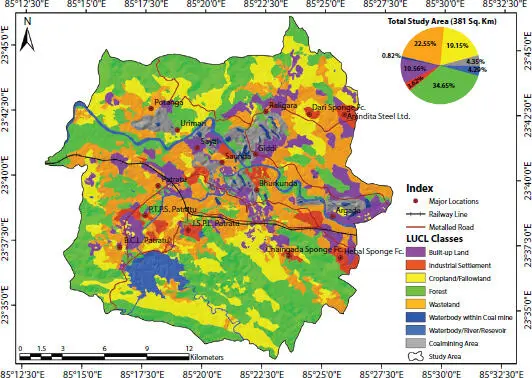
Figure 2.4 Land use/land cover map of South Karanpura Coalfield region.
In the present study, Landsat TM (January 2011) satellite image was used to prepare a LU/LC map of study area ( Figure 2.4). Visual interpretation technique was used for mapping the LU/LC map and classified into eight classes ( Table 2.1), namely, built-up land (urban/rural), industrial settlement, cropland/fallowland, forest, wasteland, water body within coal mine water body/river/reservoir, and coal mining area. The study revealed that most of the areas (34.65%) were dominated by forest that present in hilly areas. The area lies under wasteland was about 24.62% (85.90 km 2), whereas coal mining is about 16.59 km 2that is 4.35% of the total area. The area under built-up land is about 40.24 km 2(10.56%) and agricultural land (cropland/fallow land) is about 72.97 km 2, which is 19.15% of the total area ( Table 2.1). Accuracy of the prepared LU/LC map is considered reliable due to consistent field checks.
2.4.2 Thematic Layers of SVI
Vulnerability is designated as the susceptibility to stress or hazards and the capacity (or lack thereof) to prepare, cope, and recover from any hazardous event, and it expresses between scale 0 (no loss) to 1 (total loss) or as a percentage. The vulnerability also represents the degree to which a socio-economic system or physical assets is either susceptible or resilient to the impact of natural hazards [21, 31]. Selection of vulnerability indicators is directly relevant to the local study context and the particular hazards [32]. The South Karanpura coalfield is one of the major producers of sub-bituminous coal in India. There are various coal-based large (power and steel plants) and small-scale industries (sponge iron, bricks manufacturing, etc.) present in the area that may cause a serious impact on the health of the residents and environment. Therefore, to evaluate the risk due to geo-environmental hazards, understanding of socio-economic conditions of the population is of prime importance. Keeping the above point in view, the PD, total worker (TW), children below ages (0–6), and literacy rate (LR) are considered important societal elements for geo-environmental hazards and risk analysis in the South Karanpura coal mining region.
Table 2.1 Area statistics of various LU/LC classes over study area.
| Land use/land cover classes | Area (km2) | % Area |
|---|---|---|
| Built-up land | 40.24 | 10.56 |
| Coalmining area | 16.59 | 4.35 |
| Cropland/fallowland | 72.97 | 19.15 |
| Forest | 132.02 | 34.65 |
| Industrial settlement | 13.80 | 3.62 |
| Wasteland | 85.90 | 22.55 |
| Water body within coal mine | 3.12 | 0.82 |
| Water body/river/reservoir | 16.36 | 4.29 |
| Total | 381.00 | 100.00 |
2.4.2.1 Population Density
PD is a significant index of concentration of population (number of persons) per square kilometer. From a human or economic perspective, the degree of calamity associated with a disaster will depend on the PD of the affected area. Disasters with similar severity will affect more people if they occur in a highly-populated area compared to a less populated area. Saunda, Patratu, Sirka, Giddi, Chaingara, and Lapanga are the highest PD (>1,046 persons/km 2) villages in the study area ( Figure 2.5a).
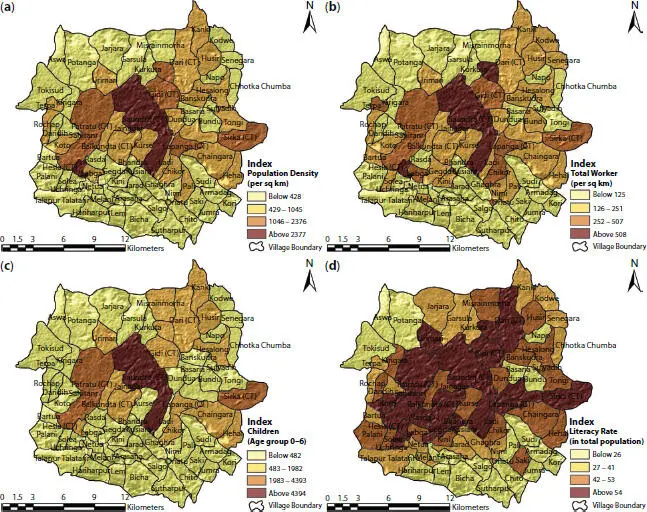
Figure 2.5 Village-level socio-economic indicators maps of (a) population density, (b) total workers, (c) children age group 0–6, (d) % literacy rate.
Читать дальшеИнтервал:
Закладка:
Похожие книги на «Sustainable Development Practices Using Geoinformatics»
Представляем Вашему вниманию похожие книги на «Sustainable Development Practices Using Geoinformatics» списком для выбора. Мы отобрали схожую по названию и смыслу литературу в надежде предоставить читателям больше вариантов отыскать новые, интересные, ещё непрочитанные произведения.


Обсуждение, отзывы о книге «Sustainable Development Practices Using Geoinformatics» и просто собственные мнения читателей. Оставьте ваши комментарии, напишите, что Вы думаете о произведении, его смысле или главных героях. Укажите что конкретно понравилось, а что нет, и почему Вы так считаете.