Sustainable Development Practices Using Geoinformatics
Здесь есть возможность читать онлайн «Sustainable Development Practices Using Geoinformatics» — ознакомительный отрывок электронной книги совершенно бесплатно, а после прочтения отрывка купить полную версию. В некоторых случаях можно слушать аудио, скачать через торрент в формате fb2 и присутствует краткое содержание. Жанр: unrecognised, на английском языке. Описание произведения, (предисловие) а так же отзывы посетителей доступны на портале библиотеки ЛибКат.

- Название:Sustainable Development Practices Using Geoinformatics
- Автор:
- Жанр:
- Год:неизвестен
- ISBN:нет данных
- Рейтинг книги:4 / 5. Голосов: 1
-
Избранное:Добавить в избранное
- Отзывы:
-
Ваша оценка:
Sustainable Development Practices Using Geoinformatics: краткое содержание, описание и аннотация
Предлагаем к чтению аннотацию, описание, краткое содержание или предисловие (зависит от того, что написал сам автор книги «Sustainable Development Practices Using Geoinformatics»). Если вы не нашли необходимую информацию о книге — напишите в комментариях, мы постараемся отыскать её.
Geoinformatics, including Remote Sensing (RS), Geographical Information System (GIS), and Global Positioning System (GPS), is a groundbreaking and advanced technology for acquiring information required for natural resource management and addressing the concerns related to sustainable development. It offers a powerful and proficient tool for mapping, monitoring, modeling, and management of natural resources. There is, however, a lack of studies in understanding the core science and research elements of geoinformatics, as well as larger issues of scaling to use geoinformatics in sustainable development and management practices of natural resources. There is also a fundamental gap between the theoretical concepts and the operational use of these advance techniques.
“Sustainable Development Practices Using Geoinformatics”
Sustainable Development Practices Using Geoinformatics — читать онлайн ознакомительный отрывок
Ниже представлен текст книги, разбитый по страницам. Система сохранения места последней прочитанной страницы, позволяет с удобством читать онлайн бесплатно книгу «Sustainable Development Practices Using Geoinformatics», без необходимости каждый раз заново искать на чём Вы остановились. Поставьте закладку, и сможете в любой момент перейти на страницу, на которой закончили чтение.
Интервал:
Закладка:
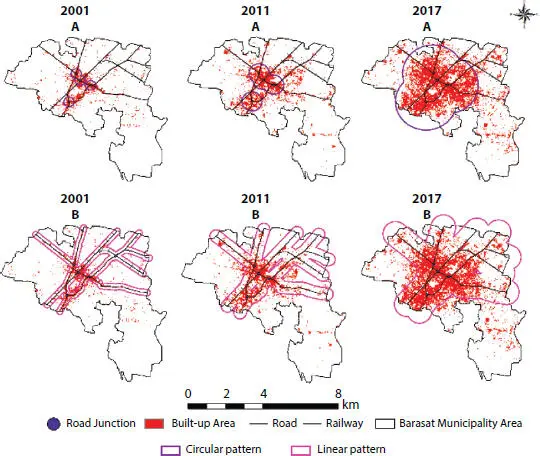
Figure 1.4 Urban Sprawl pattern from 2001 to 2017.
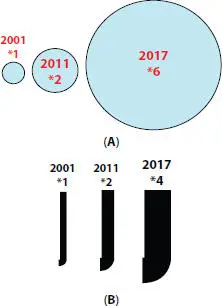
Figure 1.5 (A) The Circular pattern of increasing population from center of the city. (B) The Linear pattern of increasing population alongside road.
1.4.3 Impact of Urban Sprawl on Vegetation Cover
LULC analysis of temporal imageries clearly shows the impact of urban growth on vegetation cover in the study area. The analyzed remote sensing dataset shows that there is inverse relationship between built-up area and green space. Figure 1.6shows the amount of changes in green space based on NDVI from 2001 to 2017 through 2011. Moreover, it is also evident from the NDVI images that there is reduction not only in spatial extent of vegetation cover but also there is reduction in overall biomass and chlorophyll as well during the study period. In the year 2001, the NDVI value was ranging from −0.33 to 0.76, while in the year 2011, the lower value is around −0.10 and higher value is around 0.60 and during year 2017 the NDVI is showing lower value of −0.06 and higher value of 0.42. However, there is increase of population density in the central part and radially outward from the city since year 2011 to 2017. Moreover, the temporal NDVI images also shows that there is decrease in vegetation cover as one moves from central part of the city to edges of the study area.
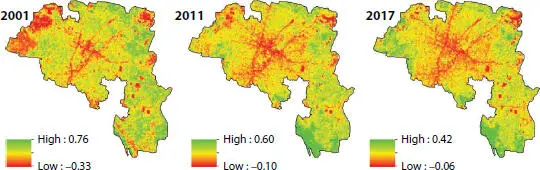
Figure 1.6 NDVI images for the year 2001, 2011, and 2017.
1.4.4 Impact of Urban Sprawl on LST
LST plays an important role in local weather phenomena. The study area was also analyzed for the changes in LST due to rapid urbanization in the study area during 2001 to 2017. LST shows a direct relationship with the built-up area. Moreover, with the increase in built area, there is gradual rise in average surface air temperature in Barasat municipal area. The temporal variation in LST as analyzed from remote sensing data are shown in Figure 1.7. It is evident from the LST obtained from analysis of temporal remote sensing images that in the year 2001, the minimum and maximum temperature was around 16.1°C and 21.9°C with average of around 19°C in the study area. Moreover, in the year 2011, the LST increased to 26.3°C as compared to maximum of 21.9°C in the year 2001 with an average of 22.3°C. However, the rise in LST of the study area for the year 2017 was observed around 20.0°C as lower value and 27.1°C as the higher with an average of around 23.5°C.
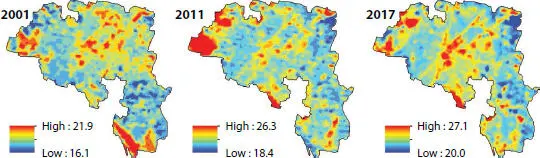
Figure 1.7 Land Surface Temperature (LST) map for the year 2001, 2011, and 2017.
1.4.5 Relationship Between NDVI and LST
The vegetation cover of a locality significantly influences LST. LST can reflect the scenario of land surface water and heat exchange process broadly. Therefore, in this study, we retrieved and tried to explore relationship between LST, NDVI, and LULC using temporal Landsat 5 and Landsat 8 remote sensing images. The results obtained shows that the spatial distribution of LST and NDVI is having negative relationship, analyzed after removing water body data ( Figure 1.8A, 1.8B& 1.8C). Moreover, it is clear from the figures given below that in all directions from center of the city the NDVI is showing inverse relationship in 2001, 2011, and 2017. However, it is also deduced from the analysis of LST against land use (LULC) that built-up area shows highest LST as against green space and built-up area with green space ( Figure 1.9). Moreover, the present analysis also shows that there is average rise in temperature from 2001 to 2017 through 2011 for each land use class. The LST observed for the green space is also comparable to the water body. The coefficient of regression is found to be negative as observed from regression analysis between NDVI and LST for the Barasat Municipality ( Figure 1.10).
1.4.6 Urban Heat Island
We have analyzed the Barasat municipality for Urban Heat Island (UHI) formation and found that, although it is a small city in comparison to Mega city like Delhi, still, it is showing a very clear UHI formation over the study area ( Figure 1.11). Temporal MODIS night time LST product (MOD11A1) downloaded from USGS were used to assess the UHI formation in Barasat. The plotted graph as shown in Figure 1.11is clearly showing the formation of UHI in the year 2001 with lesser flattening in the center of the city, which gradually increased in 2011 and 2017. Moreover, for the same time period, Landsat data was also analyzed for daytime UHI formation, and it was found that, although UHI formation is subdued in comparison to the night time UHI, still, it is significant enough to be reported.
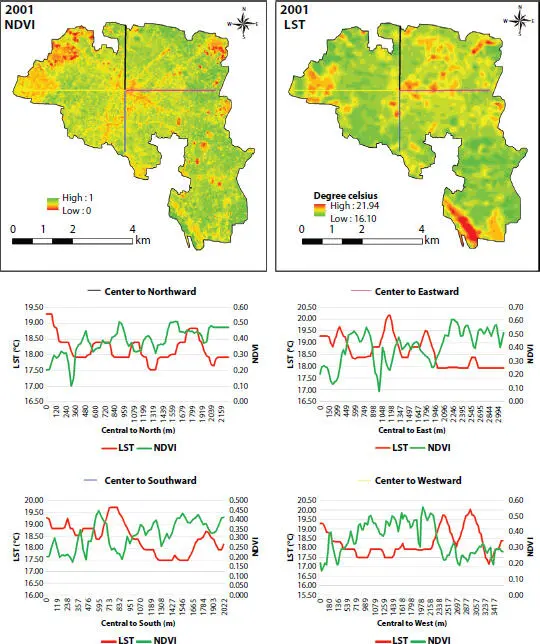
Figure 1.8A The relationship pattern between NDVI and LST from center to outward (north, south, east, and west) of Barasat municipality for the year 2001.
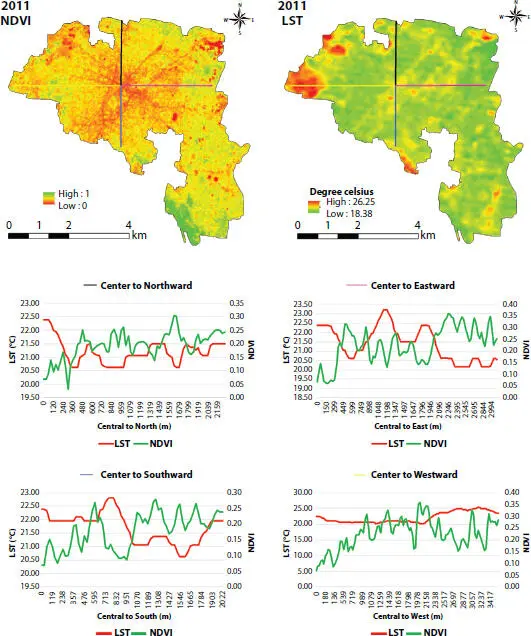
Figure 1.8B The relationship pattern between NDVI and LST from center to outward (north, south, east, and west) of Barasat municipality for the year 2011.
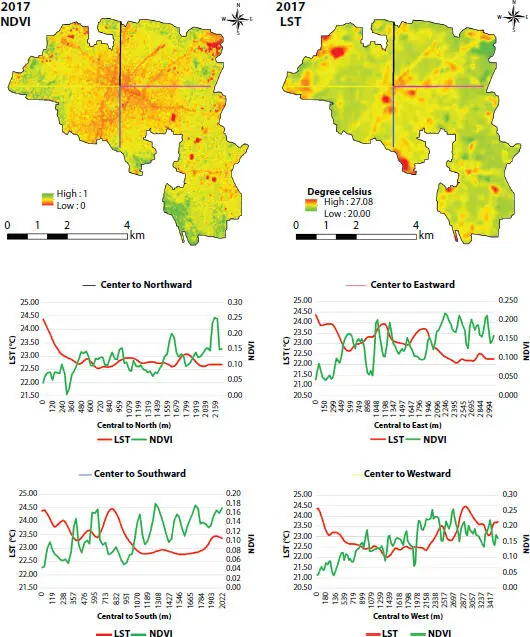
Figure 1.8C The relationship pattern between NDVI and LST from center to outward (north, south, east, and west) of Barasat municipality for the year 2017.
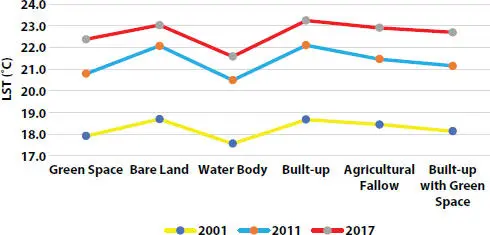
Figure 1.9 Relationship of LST with LULC classes.
1.5 Conclusion
In summary, the satellite-based remote sensing images are very impressive dataset for urban sprawl study. Moreover, GIS platform provides toolset for analyzing temporal LST and NDVI retrieval over a period, giving chance for comparison and trend delineation. Barasat municipality, although a small city is showing UHI formation, may be due to poor planning and indiscriminate urbanization. However, Barasat municipality being a sub-urban part of Kolkata is facing problem of rapid urbanization and degradation of natural vegetation. Due to poor planning and giving no space for surface air ventilation and greenery in the city, the city is under environmental stress leading to rise in LST and UHI formation. Availability of legacy remote sensing data provides good chance for comparison of changes in environmental conditions in the study area in wholesome perspective.
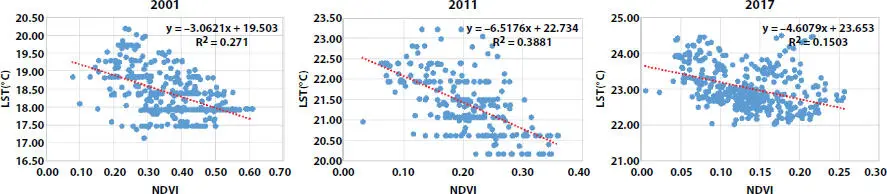
Figure 1.10 Regression analysis of LST vs. NDVI.
Читать дальшеИнтервал:
Закладка:
Похожие книги на «Sustainable Development Practices Using Geoinformatics»
Представляем Вашему вниманию похожие книги на «Sustainable Development Practices Using Geoinformatics» списком для выбора. Мы отобрали схожую по названию и смыслу литературу в надежде предоставить читателям больше вариантов отыскать новые, интересные, ещё непрочитанные произведения.


Обсуждение, отзывы о книге «Sustainable Development Practices Using Geoinformatics» и просто собственные мнения читателей. Оставьте ваши комментарии, напишите, что Вы думаете о произведении, его смысле или главных героях. Укажите что конкретно понравилось, а что нет, и почему Вы так считаете.