Sustainable Development Practices Using Geoinformatics
Здесь есть возможность читать онлайн «Sustainable Development Practices Using Geoinformatics» — ознакомительный отрывок электронной книги совершенно бесплатно, а после прочтения отрывка купить полную версию. В некоторых случаях можно слушать аудио, скачать через торрент в формате fb2 и присутствует краткое содержание. Жанр: unrecognised, на английском языке. Описание произведения, (предисловие) а так же отзывы посетителей доступны на портале библиотеки ЛибКат.
- Название:Sustainable Development Practices Using Geoinformatics
- Автор:
- Жанр:
- Год:неизвестен
- ISBN:нет данных
- Рейтинг книги:4 / 5. Голосов: 1
-
Избранное:Добавить в избранное
- Отзывы:
-
Ваша оценка:
Sustainable Development Practices Using Geoinformatics: краткое содержание, описание и аннотация
Предлагаем к чтению аннотацию, описание, краткое содержание или предисловие (зависит от того, что написал сам автор книги «Sustainable Development Practices Using Geoinformatics»). Если вы не нашли необходимую информацию о книге — напишите в комментариях, мы постараемся отыскать её.
Geoinformatics, including Remote Sensing (RS), Geographical Information System (GIS), and Global Positioning System (GPS), is a groundbreaking and advanced technology for acquiring information required for natural resource management and addressing the concerns related to sustainable development. It offers a powerful and proficient tool for mapping, monitoring, modeling, and management of natural resources. There is, however, a lack of studies in understanding the core science and research elements of geoinformatics, as well as larger issues of scaling to use geoinformatics in sustainable development and management practices of natural resources. There is also a fundamental gap between the theoretical concepts and the operational use of these advance techniques.
“Sustainable Development Practices Using Geoinformatics”
Sustainable Development Practices Using Geoinformatics — читать онлайн ознакомительный отрывок
Ниже представлен текст книги, разбитый по страницам. Система сохранения места последней прочитанной страницы, позволяет с удобством читать онлайн бесплатно книгу «Sustainable Development Practices Using Geoinformatics», без необходимости каждый раз заново искать на чём Вы остановились. Поставьте закладку, и сможете в любой момент перейти на страницу, на которой закончили чтение.
Интервал:
Закладка:
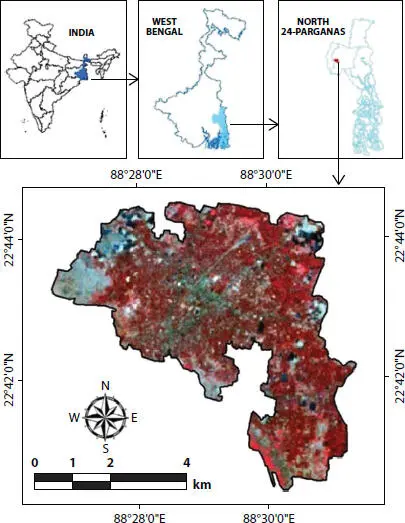
Figure 1.1 Location map of Barasat municipality.
Table 1.1 List of datasets used for the study.
| Satellite/Sensor | Date | Source |
|---|---|---|
| Landsat 5 (TM) | January, 2001 | USGS |
| Landsat 5 (TM) | January, 2011 | USGS |
| Landsat 8 (OLI and TIRS) | January, 2017 | USGS |
| MOD11A1 | January: 2001, 2011, 2017 | USGS |
| Census | 2011 | Census of India |
| Barasat municipality boundary | 2014 | Barasat municipality |
The study area was classified into six classes inclusive of built-up area, agricultural fallow, bare land, water body, green space, and built up with green space. The main aim was to measure the increase in built-up area, which is an indicator of urbanization. Further, accuracy of the classified images was calculated, and confusion matrix generated to highlight the user accuracy, producer accuracy, and Kappa statistics thus obtained (Foody 2002; Berberoglu and Akin 2009).
The urban growth is a process of urbanization, which always follows a pattern of development. In urban areas, the pattern differs from core to periphery region. In this study, two different types of pattern had been observed, one was concentric, and another one was linear. The concentric circular pattern was found in the areas of tri-junction of roads or in the “Y” point where the development is very rapid and shows multiplier effect of growth. The linear pattern of development was observed from 2001 to 2017 along the sides of roads and railway lines ( Figure 1.2), which is very common in this region. Hence, both the developmental patterns are simultaneously affecting the environment of the area significantly.
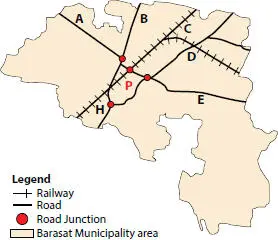
Figure 1.2 Road and railways network in Barasat municipality.
NDVI is a very popular vegetation index used to measure the biomass content of vegetation with respect to its spatial entity (Volcani, Karnieli, and Svoray 2005). Two different bands, NIR and Red of remote sensing data, are used for calculating the NDVI (Bhandari, Kumar, and Singh 2012; Yin et al ., 2012). The formula for NDVI ( Eq. 1.1) calculation is as follows:
(1.1) 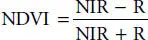
Remote sensing helps in deriving LST, which is used in various studies related to local climatology, meteorology, and climate change, etc., as the observations collected from the ground cannot provide much detailed information over a larger area (Wu et al ., 2015). LST is the temperature radiated by the surface and measured within limited boundary of lower atmosphere from the surface, which is proportionally dependent on land surface emissivity (Wan and Dozier 1996; Wang et al ., 2015; Isaya Ndossi and Avdan 2016). The LST is technically different from the Atmospheric temperature and is largely affected by the urban canopy layer. LST calculation was done with the help of Inversion of Planck’s Function (Isaya Ndossi and Avdan 2016; Zhang, Wang, and Li 2006; Srivastava et al ., 2014; Artis and Carnahan 1982; Sobrino, Caselles, and Becker 1990). The formula for LST calculation ( Eq. 1.2) is as follows:
(1.2) 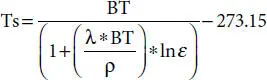
where T s= land surface temperature (°C), BT = brightness temperature (K), λ = wavelength of the emitted radiance, ρ = (h * c/σ) = 1.438 *10 −2mK, and ε = land surface emissivity
1.4 Results and Discussion
The results of the data analyzed for this study are discussed in four sections.
1.4.1 Pattern of LULC in Barasat
The temporal images of study area were classified in six classes with the help of Maximum Likelihood algorithm. The classification scheme of Land Use/Land Cover (LULC) includes the classes (1) built-up area, (2) built-up with green space, (3) agricultural fallow, (4) bare land, (5) green space, and (6) water bodies ( Figure 1.3). A drastic change is observed in the ratio of built-up area and built-up area with green vegetation in the center of the city. Moreover, the aggregation and expansion in built-up area changes rapidly after 2011.
The total area of the Barasat municipality is about 34.5 km 2as obtained by the digitized vector layer. The observed change in built-up area is ranging from 6.79% in 2001 to 29.23% in 2017, and simultaneously, there is highest decrease observed in green space ranging from 27.99% in 2001 to 11.50% in 2017 ( Table 1.2). Built-up area with green space is increasing, although at a slower rate than the pure built-up area, which implies that the municipality or concerned agency for greenery in urban space is not giving serious thought to the importance of green space in urbanization. There is decrease in surface area of water body and reduction in number of water body within the study area, which may lead to water crisis in near future.
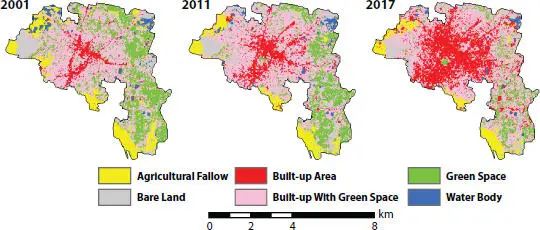
Figure 1.3 Land Use/Land Cover map of Barasat municipality (2001, 2011, and 2017).
Table 1.2 Area statistics of LULC in Barasat municipality.
| Class Name | Area in % | ||
|---|---|---|---|
| 2001 | 2011 | 2017 | |
| Bare land | 16.70 | 13.39 | 8.25 |
| Water body | 2.40 | 2.36 | 1.47 |
| Agricultural fallow | 7.92 | 4.75 | 3.74 |
| Built-up area | 6.79 | 16.38 | 29.23 |
| Built-up with green space | 38.20 | 40.79 | 45.80 |
| Green space | 27.99 | 22.33 | 11.50 |
1.4.2 Urban Sprawl
It is imperative from above classified ( Figure 1.3) remote sensing images of different time period that the LULC in Barasat municipality area is more inclined toward urbanization. Moreover, the rate of urbanization in the study area has changed rapidly within second decade than the first decennia. It is clear from Figure 1.4that there are two peculiar patterns of urban growth found in the study area. Initially, the urbanization in the study area shows the linear pattern followed by concentric development in built-up area. The Figure 1.4clearly shows that in the year 2001, there was only few clusters of built-up area, which is showing trend of linear growth in the year 2011 followed by again concentric development of built-up area in the year 2017. Moreover, due to such sequential developmental pattern in the study area, there is no space for easy air circulation within the urban domain. The scale of growth in urbanization in concentric pattern starting at scale of 1 in the year 2001, it became 2 times in the year 2011 and has increased to 6 times in the year 2017 ( Figure 1.5A). However, the scale of growth in urbanization in linear pattern has changed manifold, starting at a scale of 1 in the year 2001, it became 2 times in the year 2011 and in turn it has increased to 4 times in the year 2017 ( Figure 1.5B). The impact of concentric urbanization is greater in relation to the linear urbanization pattern during 2011 to 2017 than during 2001 to 2011 ( Figure 1.4).
Читать дальшеИнтервал:
Закладка:
Похожие книги на «Sustainable Development Practices Using Geoinformatics»
Представляем Вашему вниманию похожие книги на «Sustainable Development Practices Using Geoinformatics» списком для выбора. Мы отобрали схожую по названию и смыслу литературу в надежде предоставить читателям больше вариантов отыскать новые, интересные, ещё непрочитанные произведения.


Обсуждение, отзывы о книге «Sustainable Development Practices Using Geoinformatics» и просто собственные мнения читателей. Оставьте ваши комментарии, напишите, что Вы думаете о произведении, его смысле или главных героях. Укажите что конкретно понравилось, а что нет, и почему Вы так считаете.