A Framework of Human Systems Engineering
Здесь есть возможность читать онлайн «A Framework of Human Systems Engineering» — ознакомительный отрывок электронной книги совершенно бесплатно, а после прочтения отрывка купить полную версию. В некоторых случаях можно слушать аудио, скачать через торрент в формате fb2 и присутствует краткое содержание. Жанр: unrecognised, на английском языке. Описание произведения, (предисловие) а так же отзывы посетителей доступны на портале библиотеки ЛибКат.
- Название:A Framework of Human Systems Engineering
- Автор:
- Жанр:
- Год:неизвестен
- ISBN:нет данных
- Рейтинг книги:4 / 5. Голосов: 1
-
Избранное:Добавить в избранное
- Отзывы:
-
Ваша оценка:
A Framework of Human Systems Engineering: краткое содержание, описание и аннотация
Предлагаем к чтению аннотацию, описание, краткое содержание или предисловие (зависит от того, что написал сам автор книги «A Framework of Human Systems Engineering»). Если вы не нашли необходимую информацию о книге — напишите в комментариях, мы постараемся отыскать её.
A Framework of Human Systems Engineering
Applications and Case Studies
A Framework of Human Systems Engineering: Applications and Case Studies
A Framework of Human Systems Engineering — читать онлайн ознакомительный отрывок
Ниже представлен текст книги, разбитый по страницам. Система сохранения места последней прочитанной страницы, позволяет с удобством читать онлайн бесплатно книгу «A Framework of Human Systems Engineering», без необходимости каждый раз заново искать на чём Вы остановились. Поставьте закладку, и сможете в любой момент перейти на страницу, на которой закончили чтение.
Интервал:
Закладка:
This methodology is designed to identify areas of risk to successful project execution. Risk is defined here as the belief that the project will be challenged or fail given the alignment coefficient and the IE. Figure 3.2illustrates the possible outcomes of the IE.
For this discussion, stability S is defined as follows:
(3.4) 
S is used with the alignment coefficient to calculate confidence. If the project has a high alignment coefficient score across the relationships and S is large, it can be plotted in Zone 1, and there is good confidence that the project will succeed. A project that has high alignment coefficient, but low S (Zone 2), is a project of concern with low confidence of success and an analysis warranted to identify why the stability of the environment of the project is low, potentially indicating hidden factors. Zone 4 indicates a project that has both a low alignment coefficient score and low S , which would indicate there should be serious lack of confidence that the project will succeed. Zone 3 has high S but low alignment coefficient; this is an area of concern that may be recoverable, and deeper analysis is warranted to understand why the alignment coefficient scores are low. Figure 3.9plots belief alignment against environment stability; for the purposes of this figure, confidence is defined as
(3.5) 
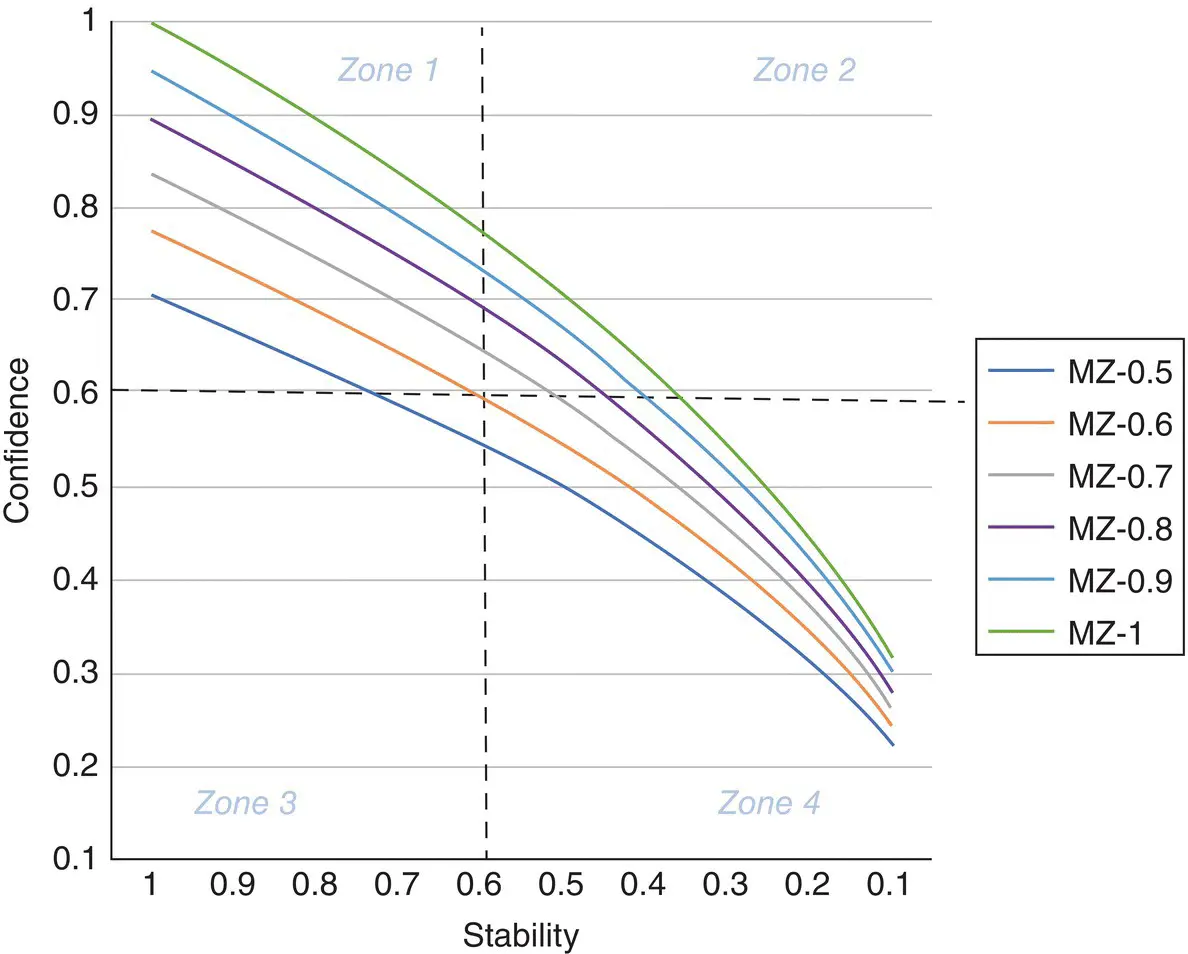
Figure 3.9 Confidence vs. stability.
For both projects, a retrospective study was employed in which the concept of digital twins was used to construct the model using the concepts described above. Six events were identified in which information from sensors was collected and reviewed. Figure 3.10shows the project events used for the model. Different, yet equivalent, events were used because Project One followed a traditional SE and project management approach and Project Two employed SAFe, agile, and scrum methodologies to manage the project.
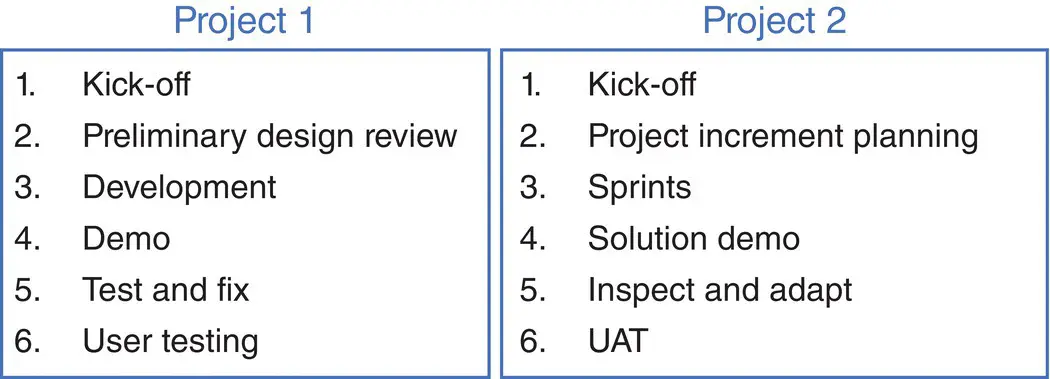
Figure 3.10 Case study project events.
3.12 Results
The case study comparison of Project One and Project Two demonstrates the effects of employing sociotechnical constructs, AI, and HSE into the development environment. Comparatively, the results from the model are plotted showing belief alignment and stability (see Figure 3.11). As noted, belief alignment is generated by calculating the geomean of belief coefficients derived from a series of questions, noted previously. Stability is calculated using 1 minus IE ( S = 1 − IE). Four zones were defined to aid in analysis:
Zone 1 (belief > 0.6; stability > 0.6): Projects scoring in Zone 1 generally have a high probability of success.
Zone 2 (belief > 0.6; stability < 0.6): Projects scoring in Zone 2 demonstrate a high level of confidence in the alignment and cohesiveness of the stakeholders but present challenges in that the environment itself and/or the belief alignment is unstable due to exogenous influences.
Zone 3 (belief < 0.6; stability > 0.6): Projects scoring in Zone 3 demonstrate a low level of confidence in the alignment and cohesiveness of the stakeholders, while the environment itself and/or the belief alignment is relatively stable with minimal expected change or exogenous influences. Note that this stable structure does not mean it is good – only that it is deterministic.
Zone 4 (belief < 0.6; stability < 0.6): Projects scoring in Zone 4 exhibit one or more behaviors and associated risks that are commonly identified root causes of failed projects.
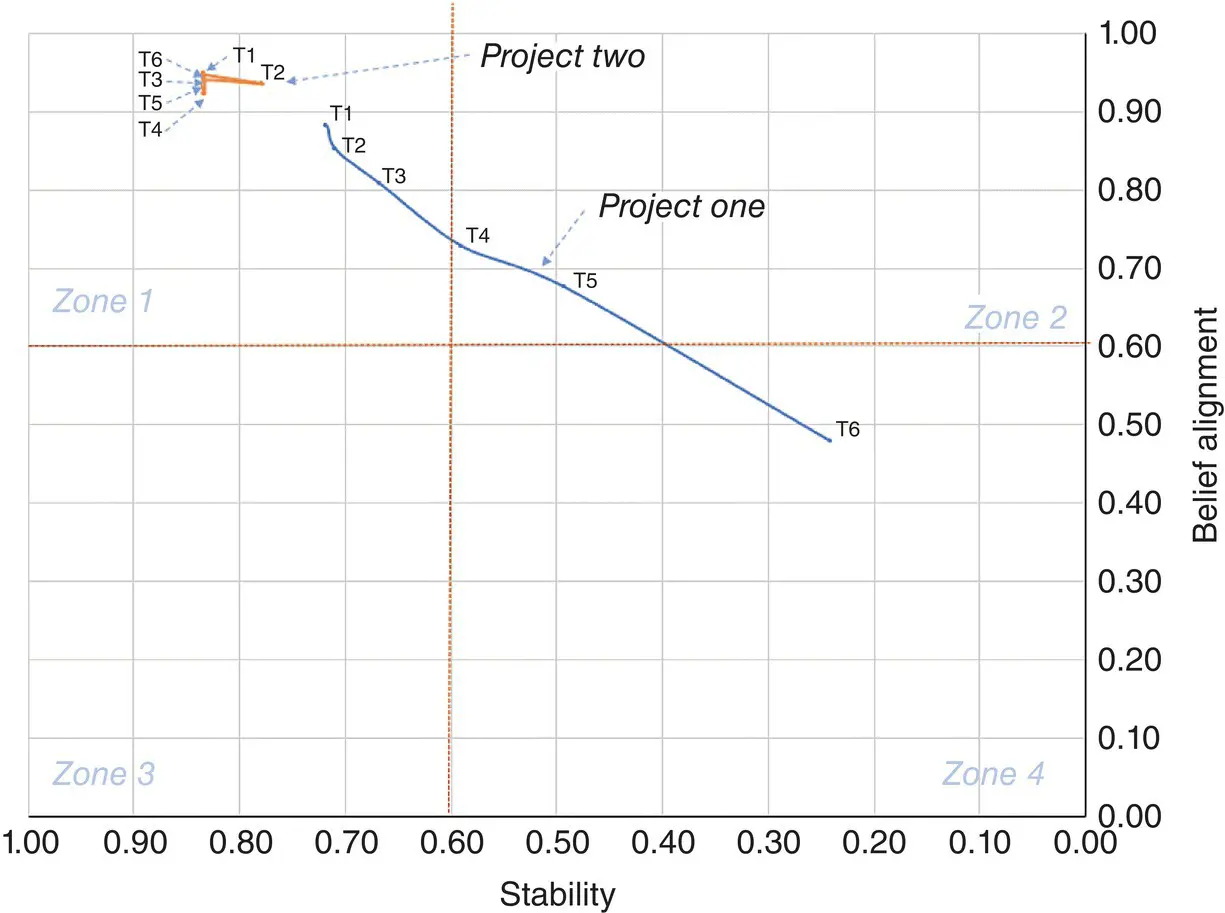
Figure 3.11 Belief alignment and stability results for case study.
Analysis was performed using the conceptual architecture for Epoch 4 as a means of comparing and determining value of evolving SE toward Epoch 4 (see Table 3.1).
Table 3.1 Case study comparative analysis.
| Project One | Project Two | |
|---|---|---|
| Systems engineering frameworks | Employed a generic and linear systems engineering model where each activity was independent and completed its full activity before moving to the next phase, e.g. all requirements gathered prior to development | The project team used SAFe, agile SW development, and scrum techniques to continuously evolve the solution and deliver incremental value where feedback was incorporated into future design considerations and development environment structure |
| Sociotechnical network models | Measures of belief were ascertained after events occurred and misalignment had already degraded relationships. In post‐project analysis, it was clear that stakeholders were unaware of belief misalignment or were anchored in their beliefs and unwilling to change | The project team developed a structure network of stakeholders identifying roles and responsibilities and used the network to ensure communications challenge were actively being used to ensure alignment between stakeholders |
| Temporal sociotechnical measures | Traditional project measures were used to measure progress – cost, schedule, and quality. No quantitative measures of stakeholder alignment nor stability were calculated. Small groups aired concerns among themselves created an environment where factions were actively working against project progress in order to protect their personal interests | Stakeholders used active measuring and a cultural shift toward seeking out and resolving misalignment of beliefs. Open communications were the norm where identifying and sharing risks, discrepancies, and differing opinions were seen as a positive behavior |
| Digital twin/AI | No modeling or use of AI to model the ecosystem transpired. Nor were there efforts to understand effects of events prior to their occurrence | The project team used basic model‐based engineering techniques and rudimentary AI techniques to assess alternative courses of action throughout the project life cycle |
Overall, for Project One, eroding belief alignment was evident over the life of the program as the stakeholders did not learn from previous activities and outcomes and instead hardened their own beliefs. Once these patterns were set, the culture of the project made it hard to change the patterns of behavior and project structure. As can be seen, the project had a consistent trajectory leading from initial confidence to the reality of a poorly run project. Conversely, the culture of Project Two employed open communications across all stakeholders and maintained the idea of being a learning organization that actively sought to improve throughout the project life cycle. Continuous alignment and high stability in the project are evidenced by the low variation in measurements for Project Two over time.
While this is an initial study, indications are that the constructs of Epoch 4 will improve success in quality project deployment. As more projects follow these constructs, it is hoped that future studies will prove the value of employing HSE and AI into the development environment.
Читать дальшеИнтервал:
Закладка:
Похожие книги на «A Framework of Human Systems Engineering»
Представляем Вашему вниманию похожие книги на «A Framework of Human Systems Engineering» списком для выбора. Мы отобрали схожую по названию и смыслу литературу в надежде предоставить читателям больше вариантов отыскать новые, интересные, ещё непрочитанные произведения.


Обсуждение, отзывы о книге «A Framework of Human Systems Engineering» и просто собственные мнения читателей. Оставьте ваши комментарии, напишите, что Вы думаете о произведении, его смысле или главных героях. Укажите что конкретно понравилось, а что нет, и почему Вы так считаете.