A Framework of Human Systems Engineering
Здесь есть возможность читать онлайн «A Framework of Human Systems Engineering» — ознакомительный отрывок электронной книги совершенно бесплатно, а после прочтения отрывка купить полную версию. В некоторых случаях можно слушать аудио, скачать через торрент в формате fb2 и присутствует краткое содержание. Жанр: unrecognised, на английском языке. Описание произведения, (предисловие) а так же отзывы посетителей доступны на портале библиотеки ЛибКат.

- Название:A Framework of Human Systems Engineering
- Автор:
- Жанр:
- Год:неизвестен
- ISBN:нет данных
- Рейтинг книги:4 / 5. Голосов: 1
-
Избранное:Добавить в избранное
- Отзывы:
-
Ваша оценка:
A Framework of Human Systems Engineering: краткое содержание, описание и аннотация
Предлагаем к чтению аннотацию, описание, краткое содержание или предисловие (зависит от того, что написал сам автор книги «A Framework of Human Systems Engineering»). Если вы не нашли необходимую информацию о книге — напишите в комментариях, мы постараемся отыскать её.
A Framework of Human Systems Engineering
Applications and Case Studies
A Framework of Human Systems Engineering: Applications and Case Studies
A Framework of Human Systems Engineering — читать онлайн ознакомительный отрывок
Ниже представлен текст книги, разбитый по страницам. Система сохранения места последней прочитанной страницы, позволяет с удобством читать онлайн бесплатно книгу «A Framework of Human Systems Engineering», без необходимости каждый раз заново искать на чём Вы остановились. Поставьте закладку, и сможете в любой момент перейти на страницу, на которой закончили чтение.
Интервал:
Закладка:
The difference and the size for each element in the classifier was used to derive a coefficient that provided an indication of risk in achieving that element. Equation 3.1describes the belief coefficient, a tunable coefficient derived from heuristics and project experience:
(3.1) 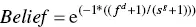
where
f is the difference for a given criterion
s is the value for stability/maturity
d and g are real values used to emphasize the contribution of size over maturity or vice versa
Belief values run from 0 to 1, where lower values indicate significant risk for project success for a given criterion
The belief coefficient equation was developed for large‐scale, contract‐based, custom IT projects in which a relationship with the stakeholder is integral to the delivery of the project. In essence, alignment with the stakeholder has been found to be equal to or greater in priority than maturity or stability of the environment as determined by the responses to the project classifier questions.
To assess the overall information risk profile of the project, the authors computed a single value that aggregated the belief coefficients across the project. The authors calculated the geometric mean of the belief values as shown in Equation 3.2. The geometric mean is commonly used to find a single value when trying to aggregate criteria with different properties:
(3.2) 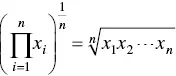
where
x’s are individual belief coefficients for each criterion in the project classifier
The intent of using the geometric mean of the belief coefficients is to provide a singular aggregate risk for a project in terms of where information and communication are critical to project success, where belief values approaching 1 presume high alignment and ecosystem stability for a program and values approaching 0 denote areas of concern that require attention. Additionally, as belief coefficients approach 0, the velocity of decision making should be expected to increase to account for the abundance of uncertainty.
As stated, the goal of this research was to identify sources of hidden risk in the programmatic underpinnings of system development efforts. To do it, the authors used the following logic to translate the beliefs of the stakeholders and the evidence that drives these beliefs into a Bayesian belief network (BBN). Expert elicitation of individuals involved in the system development projects and along with a review of published artifacts was used to develop prior probabilities, such as success and failure rates for project based on the Standish Group’s Chaos Report for 2015 (The Standish Group, International, Inc., n.d.). Figure 3.7is provided as an exemplar of BBN construction.
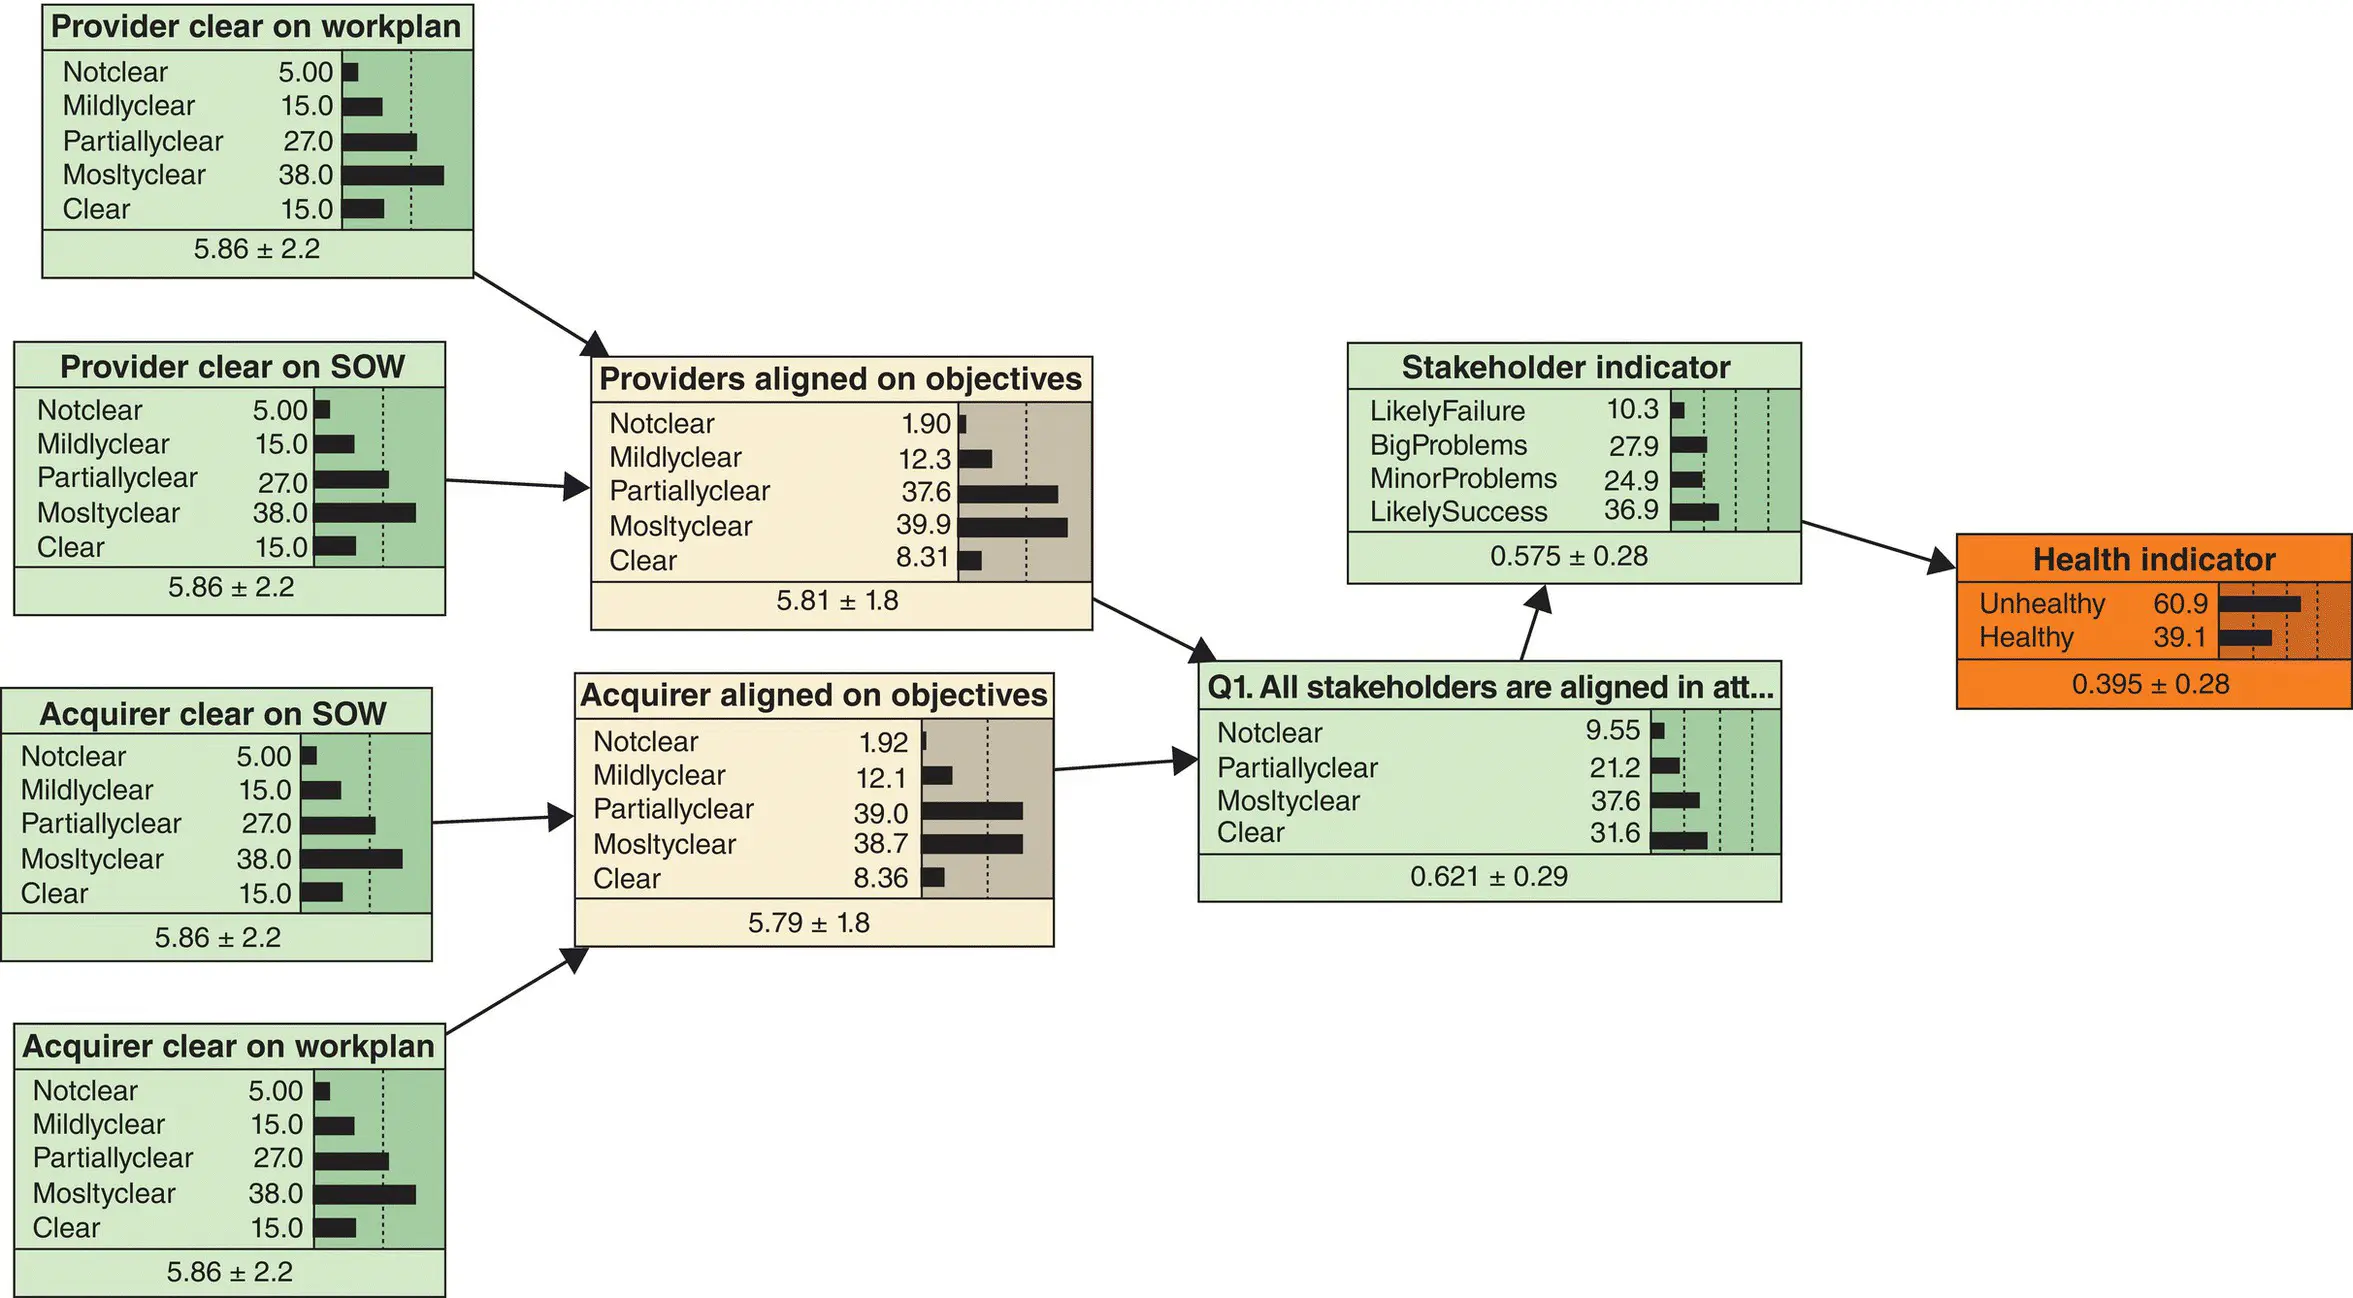
Figure 3.7 BBN example element.
The scalar measures were then translated into a logistics distribution curve, i.e. the belief coefficients. The belief coefficients indicate areas of misalignment in beliefs between stakeholders, where the beliefs are not objective measures of reality but instead the best understanding of the beliefs of other stakeholders’ expectations, if direct collection of beliefs is unavailable. The belief coefficients were categorized based on their position of the logistics distribution curve. This categorization gives practitioners an indication of the material weaknesses within the system development environment and profiles where risk may be present yet unidentified. Note that these categorizations will vary for different types of system development project genres.
3.11.1 Modeling the Project
There are two major components of designing the social system and technical system in tandem in order for them to work together so that the interaction of social and technical factors creates the conditions for successful organizational performance. IE was used as a measure of environment stability, and belief coefficients were used as a measure of alignment of sociotechnical attributes.
IE was used as a means of gauging confidence in the conditions for success in a multi‐stakeholder environment. IE calculations provided a measure of project environment stability. Changes in entropy provided a mechanism to examine the project over time and to understand the patterns that model environments for success or failure.
The analysis began by modeling the project stakeholders and their relationships as a graph, where edges are assumed to be bidirectional (see Figure 3.8). The edges represent the relationships between the stakeholders, and the strength of the relationships as well as the alignment is defined by the integration of the belief coefficients scores for the belief questions.

Figure 3.8 Case study project social network.
As can be seen, the project is composed of stakeholders that must work together to deliver the project. For expediency, calculations were made for the edges connected to the program team/PIO.
In addition to looking at the overall enterprise modeled as a graph structure, it is important to look at the evolution of the alignment coefficients and the overall alignment coefficient over time. Specifically, it is desirable to determine whether the analysis can assess whether the project will succeed based on current and past behavior. For example, random behavior between measuring periods will probably indicate poor predictability of future states. Correspondingly, reasonably stable behavior is an indicator of future performance. Information theory provides a ready measure of the randomness in the system with IE. IE is defined as
(3.3) 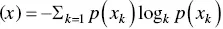
where k refers to the number of distinct states the system may be in.
As the IE rises for a relation (edge) or the system, the randomness rises, and the stability of the project environment falls as does the ability of the model to predict future behavior. Correspondingly, as the IE falls, the stability of the project increases, and the ability of the model to predict future behavior rises. To apply this discrete formula for assessing stakeholder alignment, the continuous distribution of stakeholder alignment was broken down into several distinct states.
IE was chosen as a measure that is at a maximum when the probability of all possible outcomes is equivalent; in essence there is no information that would allow a more educated prediction. Experimental testing indicates the values of both edges, and the system at large generally will cluster around several peak values. If variance (𝜎) was chosen as a measure, it would obscure this information as it is not sensitive to multiple modes. In fact, it is possible that (𝑥) might increase, while 𝜎 could decrease. Consequently, using variance alone would indicate less disorder and more confidence in the model than would be warranted.
Читать дальшеИнтервал:
Закладка:
Похожие книги на «A Framework of Human Systems Engineering»
Представляем Вашему вниманию похожие книги на «A Framework of Human Systems Engineering» списком для выбора. Мы отобрали схожую по названию и смыслу литературу в надежде предоставить читателям больше вариантов отыскать новые, интересные, ещё непрочитанные произведения.


Обсуждение, отзывы о книге «A Framework of Human Systems Engineering» и просто собственные мнения читателей. Оставьте ваши комментарии, напишите, что Вы думаете о произведении, его смысле или главных героях. Укажите что конкретно понравилось, а что нет, и почему Вы так считаете.