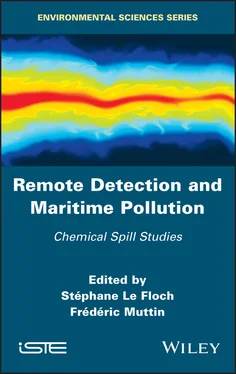
Remote Detection and Maritime Pollution
Здесь есть возможность читать онлайн «Remote Detection and Maritime Pollution» — ознакомительный отрывок электронной книги совершенно бесплатно, а после прочтения отрывка купить полную версию. В некоторых случаях можно слушать аудио, скачать через торрент в формате fb2 и присутствует краткое содержание. Жанр: unrecognised, на английском языке. Описание произведения, (предисловие) а так же отзывы посетителей доступны на портале библиотеки ЛибКат.
- Название:Remote Detection and Maritime Pollution
- Автор:
- Жанр:
- Год:неизвестен
- ISBN:нет данных
- Рейтинг книги:5 / 5. Голосов: 1
-
Избранное:Добавить в избранное
- Отзывы:
-
Ваша оценка:
- 100
- 1
- 2
- 3
- 4
- 5
Remote Detection and Maritime Pollution: краткое содержание, описание и аннотация
Предлагаем к чтению аннотацию, описание, краткое содержание или предисловие (зависит от того, что написал сам автор книги «Remote Detection and Maritime Pollution»). Если вы не нашли необходимую информацию о книге — напишите в комментариях, мы постараемся отыскать её.
Remote Detection and Maritime Pollution — читать онлайн ознакомительный отрывок
Ниже представлен текст книги, разбитый по страницам. Система сохранения места последней прочитанной страницы, позволяет с удобством читать онлайн бесплатно книгу «Remote Detection and Maritime Pollution», без необходимости каждый раз заново искать на чём Вы остановились. Поставьте закладку, и сможете в любой момент перейти на страницу, на которой закончили чтение.
Интервал:
Закладка:
8 PART 4: Remote Sensing for Exploration
10 Potential of Imaging UAVs for Coastal Monitoring
10.1. Introduction 10.2. Constraints on the survey
10.3. Examples of UAV platforms
10.4. Survey protocol
10.5. Data processing
10.6. Examples of applications
10.7. Conclusion
10.8. References
11 Use of Remote Sensing Techniques to Survey, Detect and Interpret Hydrocarbon Seeps and Spills for Exploration and Environment
11.1. Introduction 11.2. Methodology
11.3. Offshore facilities monitoring/mining field
11.4. Emergency
11.5. Perspectives
11.6. Conclusion
11.7. References
12 Natural Escapes of Oil in Sedimentary Basins: Space-borne Recognition and Pairing with Seafloor and Sub-seafloor Features
12.1. Introduction 12.2. Datasets and methods
12.3. Results
12.4. Conclusion
12.5. References
9 Conclusion
10 List of Authors
11 Index
12 End User License Agreement
List of Illustrations
1 Chapter 1Figure 1.1. (a) Aluminum frame installed in the CEDRE pool. (b) Aerial lift with...Figure 1.2. One cubic-meter tank. (a) HDPE. (b) Metal Figure 1.3. Releases of heptane and toluene Figure 1.4. Map of sea surface of tank and drifting buoy positions during the fi...Figure 1.5. Releases from on board the Ailette (a) and rapeseed oil slick (b)
2 Chapter 2Figure 2.1. SETHI – instrumental noise at X-band (left) and L-band (right) Figure 2.2. First flight: heptane and toluene release from semi-submersible tank Figure 2.3. Second flight: methanol and xylene release from the boat Figure 2.4. Third flight: rapeseed oil (left) and FAME (right) release from the ...Figure 2.5. Ocean waves in resonance with the EM signal (Bragg mechanism). For a...Figure 2.6. X-VV SAR images over xylene – upwind 13:25 UTC (top) and crosswind 1...Figure 2.7. SAR images over rapeseed oil and FAME – X-VV (top) and L-VV (bottom)...Figure 2.8. Range profile at X-band (red) and L-band (blue). For a color version...Figure 2.9. Normalized polarization difference (NPD) at X-band (upper) and at L-...Figure 2.10. Normalized polarization difference (NPD) at X-band (upper) and L-ba...Figure 2.11. Normalized polarization difference (NPD) range profiles over xylene...Figure 2.12. Photos taken from the ship during the release of FAME (left) and ra...Figure 2.13. MW (top), Mα (middle) and Mdex (bottom) – L-band SAR acquisitions a...Figure 2.14. Histograms: NPD L-band (black), NPD X-band (dash black), MW (red), ...
3 Chapter 3Figure 3.1. Photo of the Hyper-Cam LWIR imaging sensor Figure 3.2. (a) Hyper-Cam LWIR imaging sensor installed on platform of a boom li...Figure 3.3. Region of the spill area viewed by the Hyper-Cam, and the container ...Figure 3.4. Airborne platform for flying the Hyper-Cam instrument in a fixed-win...Figure 3.5. Step-and-stare airborne measurement configuration for an interferome...Figure 3.6. (a) Cessna C-303 aircraft deployed with (b) Hyper-Cam airborne syste...Figure 3.7. Absorbance signatures of various chemicals spilled at the CEDRE basi...Figure 3.8. (a) Visible image of the spill confinement zone; (b) Hyper-Cam infra...Figure 3.9. (a) Detection results from a 5 L spill of diethyl ether, similar to ...Figure 3.10. (a) Visible image of the spill confinement zone, for p-xylene; (b) ...Figure 3.11. (a) Visible image of the spill confinement zone for toluene; (b) Hy...Figure 3.12. (a) Infrared image of a colza oil slick measured at 15:20 UTC (17:2...Figure 3.13. GLRT detection results of (a) colza oil slick and (b) FAME slick. T...
4 Chapter 4Figure 4.1. The F406 POLMAR III Figure 4.2. The F406 POLMAR II Figure 4.3. Comparison between the visual picture and microwave images. For a co...Figure 4.4. Computer inside the F406 POLMAR III Figure 4.5. SLAR and IR coverage. For a color version of the figure, see www.ist...Figure 4.6. SLAR image Figure 4.7. IR and UV images Figure 4.8. Standard detection process Figure 4.9. The new maritime patrol aircraft in development
5 Chapter 6Figure 6.1. Typical map for long-term surveillance. For a color version of the f...Figure 6.2. Variability in the non-algal SPM at the beginning of March 2008 and ...Figure 6.3. The percentile 90 of Chlorophyll-a over the productive period 2003–2...Figure 6.4. A Karenia mikimotoi bloom observed in situ and from space in July 20...Figure 6.5. A typical bloom of coccolithophore occurring in June on the margin o...
6 Chapter 7Figure 7.1. Task areas of CleanSeaNet 3rd Generation. For a color version of the...Figure 7.2. Left: vessel detection reports with two classes of confidence. Right...Figure 7.3. Sea surface roughness and oil spill. For a color version of the figu...Figure 7.4. Oil pollution and ship connected to the spill, with AIS identificati...Figure 7.5. Oil pollution and ship connected to the spill for the case of MAERSK...Figure 7.6. Integration of drift modeling for polluter identification in the CLS...
7 Chapter 8Figure 8.1. Snapshots of the main decision support systems used in the North Sea...Figure 8.2. Example of a SAR image made available to CleanSeaNet users through t...Figure 8.3. In cases where possible slicks are detected, coastal state administr...Figure 8.4. Physical processes included in the OSERIT oil spill model Figure 8.5. Screenshot of OSERIT Web-based visualization tool. For a color versi...Figure 8.6. The domain covered by OSERIT. The inner blue rectangle shows the are...Figure 8.7. Scatter plot between viscosity and API for each oil type of the OSER...Figure 8.8. Oil type list available within the OSERIT oil database [DUL 13] Figure 8.9. OSERIT forecast simulation results as presented in the CleanSeaNet G...Figure 8.10. Location of the Flinterstar wreck Figure 8.11. Oil spill response at sea during the Flinterstar incident: (a) Arca...Figure 8.12. Illustrations of Flinterstar wreck and the significant initial oil ...Figure 8.13. OSERIT 3-day oil drift model simulation for the period October 6 to...Figure 8.14. (a) Example of manually triggered simulation results of the system-...
8 Chapter 9Figure 9.1. CEPPOL SUAS (3DR Solo and GoPro 3+Black) Figure 9.2. Visual detection of rice husk from 100 m altitude (SUAS: 3DR Solo & ...Figure 9.3. Rice husks (left) and fluorescein (right) detection field tests (alt...Figure 9.4. CEPPOL SUAS experimental visible and multi-spectral bands
9 Chapter 10Figure 10.1. Localization of DYNALIT study sites Figure 10.2. Various models of drones implemented by the Domaines Océaniques lab...Figure 10.3. DRELIO 10 system configuration and primary steps during a drone sur...Figure 10.4. Orthophotograph and digital elevation model (DEM) of the beach of P...Figure 10.5. Example of the DEM of difference made from the photogrammetric DEM ...Figure 10.6. Performing UAV surveys in different coastal environments: a) estuar...
10 Chapter 12Figure 12.1. Inventory of published locations of natural occurrence of oil seeps...Figure 12.2. Stack of SAR data coverage used to identify recurrent natural seepa...Figure 12.3. Principle of acoustic wave propagation for imaging sedimentary seri...Figure 12.4. Identification of floating oil at the sea surface using space-borne...Figure 12.5. A) Extract from ASAR WSM SAR scene dated March 26, 2012. The gray s...Figure 12.6. A) Compilation map of the outline of sea surface slicks (red polygo...Figure 12.7. A) Extract of SAR scene dated from June 30, 2009, allowing the reco...Figure 12.8. A, B) line drawing and wide seismic cross section through underlyin...
List of Tables
1 Chapter 1Table 1.1. Environmental conditions
Читать дальшеИнтервал:
Закладка:
Похожие книги на «Remote Detection and Maritime Pollution»
Представляем Вашему вниманию похожие книги на «Remote Detection and Maritime Pollution» списком для выбора. Мы отобрали схожую по названию и смыслу литературу в надежде предоставить читателям больше вариантов отыскать новые, интересные, ещё непрочитанные произведения.
Обсуждение, отзывы о книге «Remote Detection and Maritime Pollution» и просто собственные мнения читателей. Оставьте ваши комментарии, напишите, что Вы думаете о произведении, его смысле или главных героях. Укажите что конкретно понравилось, а что нет, и почему Вы так считаете.


