Jörg Flock - X-Ray Fluorescence Spectroscopy for Laboratory Applications
Здесь есть возможность читать онлайн «Jörg Flock - X-Ray Fluorescence Spectroscopy for Laboratory Applications» — ознакомительный отрывок электронной книги совершенно бесплатно, а после прочтения отрывка купить полную версию. В некоторых случаях можно слушать аудио, скачать через торрент в формате fb2 и присутствует краткое содержание. Жанр: unrecognised, на английском языке. Описание произведения, (предисловие) а так же отзывы посетителей доступны на портале библиотеки ЛибКат.
- Название:X-Ray Fluorescence Spectroscopy for Laboratory Applications
- Автор:
- Жанр:
- Год:неизвестен
- ISBN:нет данных
- Рейтинг книги:5 / 5. Голосов: 1
-
Избранное:Добавить в избранное
- Отзывы:
-
Ваша оценка:
X-Ray Fluorescence Spectroscopy for Laboratory Applications: краткое содержание, описание и аннотация
Предлагаем к чтению аннотацию, описание, краткое содержание или предисловие (зависит от того, что написал сам автор книги «X-Ray Fluorescence Spectroscopy for Laboratory Applications»). Если вы не нашли необходимую информацию о книге — напишите в комментариях, мы постараемся отыскать её.
on using X-ray fluorescence for laboratory applications
This book focuses on the practical aspects of X-ray fluorescence (XRF) spectroscopy and discusses the requirements for a successful sample analysis, such as sample preparation, measurement techniques and calibration, as well as the quality of the analysis results.
X-Ray Fluorescence Spectroscopy for Laboratory Applications
X
An important resource for the analytical chemist, providing concrete guidelines and support for everyday analyses Focuses on daily laboratory work with commercially available devices Offers a unique compilation of knowledge and best practices from equipment manufacturers and users Covers the entire work process: sample preparation, the actual measurement, data processing, assessment of uncertainty, and accuracy of the obtained results
appeals to analytical chemists, analytical laboratories, materials scientists, environmental chemists, chemical engineers, biotechnologists, and pharma engineers.
X-Ray Fluorescence Spectroscopy for Laboratory Applications — читать онлайн ознакомительный отрывок
Ниже представлен текст книги, разбитый по страницам. Система сохранения места последней прочитанной страницы, позволяет с удобством читать онлайн бесплатно книгу «X-Ray Fluorescence Spectroscopy for Laboratory Applications», без необходимости каждый раз заново искать на чём Вы остановились. Поставьте закладку, и сможете в любой момент перейти на страницу, на которой закончили чтение.
Интервал:
Закладка:
Because the energy of the primary radiation must be higher than that of the fluorescence radiation, the penetration depth is always greater than the information depth. These geometric relations are shown in Figure 3.1.
The information depth d informationof the radiation can be estimated from Lambert–Beer's law (2.5), as well as from the measurement geometry shown in Figure 3.1. If it is assumed that about 95% of the fluorescence radiation comes from this layer, the information depth is calculated as
(3.1) 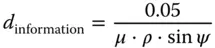
This relation for a few different matrices and ψ = 90° is shown in Figure 3.2.
For the fluorescence energy of a specific element, the information depth is shown here for different matrices. Since the information depth is only an approximate measure of the layer thicknesses contributing to the measurement signal, this representation is sufficient for an estimation. For other matrix compositions, it is possible to interpolate between these relations. It should also be taken into account that the information depth in Figure 3.2is given for a perpendicular incidence. Usually however, there is an incident angle close to 45°, which reduces the information depth according to (3.1)by a factor of about 1.4.
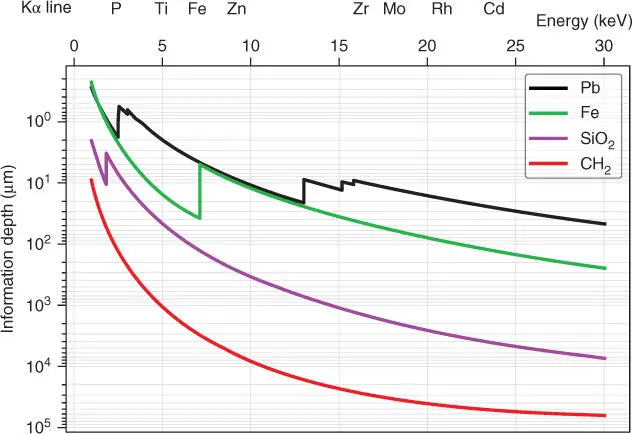
Figure 3.2 Information depth for different matrices.
Table 3.2 Information depth for different fluorescence lines in various materials.
| Fluorescence line | Energy (keV) | Graphite (μm) | Silicon oxide (μm) | Steel (μm) | Lead (μm) |
|---|---|---|---|---|---|
| B-Kα 1 | 0.18 | 4 | 0.13 | 0.01 | 0.01 |
| F-Kα 1,2 | 0.68 | 3.7 | 1.7 | 0.4 | 0.3 |
| Mg-Kα 1 | 1.25 | 20 | 7 | 2 | 1 |
| S-Kα 1 | 2.31 | 116 | 15 | 10 | 5 |
| Cr-Kα 1 | 5.41 | 1 600 | 100 | 104 | 7 |
| Ni-Kα 1 | 7.48 | 4 000 | 300 | 30 | 17 |
| Cd-Kα 1 | 23.17 | 14 500 | 8 000 | 700 | 77 |
Table 3.3 Information depth and accumulated intensity in the case of 10 wt% Ni in different matrices.
| Matrix | Mass absorption coefficient (g/cm 2) | Information depth (μm) | Count rate in case of 10 wt% (cps) |
|---|---|---|---|
| Steel | 333 | 10.3 | 6 000 |
| Aluminum | 60 | 170 | 35 000 |
| Polyethylene | 15 | 1 300 | 170 000 |
Table 3.2gives an overview of the information depth of different fluorescence lines in various materials. It shows, the information depth covers 6 orders of magnitude for these materials. This has to be considered for the sample preparation. The surface layer of the material to be analyzed needs to be homogeneous and representative of the corresponding fluorescence line in this material.
The influence of a different absorption of fluorescence radiation in the matrix on the information depth and the measured intensity is demonstrated in Table 3.3for the element Ni. It shows very strong changes not only in information depth but also in accumulated intensity depending on the matrix. A factor of almost 30 is observed for the same content of Ni in different matrices. These changes must be considered in case of quantification.
Considering these information depths, the volume contributing to the measurement signal as well as the corresponding sample mass can be estimated depending on the excited sample surface, the sample matrix, and the element under consideration. Table 3.4summarizes the volume and the analyzed mass in metallic and mineral matrices for different spot diameters. These volumes and masses are very small in metallic or mineral matrices, i.e. only a few mm 3; or mg contribute to the measurement signal, but in the case of light matrices such as aqueous solutions or polymers they can be relatively large.
Table 3.4 Estimations of the sample volume and mass that contribute to the measured signal.
| Excited area (mm) | Volume/analyzed mass for | ||||
|---|---|---|---|---|---|
| Si in SiO 2 | Si in steel | Fe in SiO 2 | Fe in steel | Cd in aqueous solution | |
| ∅ 20 | 6 mm 3 | 0.6 mm 3 | 72 mm 3 | 23 mm 3 | 7500 mm 3 |
| 16 mg | 5 mg | 190 mg | 175 mg | 7.5 g | |
| ∅ 0.3 | 0.001 mm 3 | 0.0001 mm 3 | 0.005 mm 3 | 0.0015 mm 3 | 1.7 mm 3 |
| 0.003 mg | 0.0016 mg | 0.015 mg | 0.04 mg | 1.7 mg |
The sample preparation must therefore guarantee that the material of this surface layer within its information depth sufficiently characterizes the material to be analyzed. This means
that in the case of surface contamination it is important to ensure that their thicknesses are small compared to the information depth and thus cannot influence the analytical result too much;
that the surface roughness should be small against the information depth so that the absorption lengths of the fluorescence radiation are not influenced by topological effects – this influence can be reduced by rotating the sample during the measurement; or
that for light matrices and high fluorescence energies, the information depth can exceed the sample thickness. Then the measured fluorescence intensity depends not only on the concentration of the analyte but also on the sample thickness. This is shown in Figure 3.3for the intensities of Cd in polymer samples of different thicknesses. This problem can be solved by using the same amount of sample material for all analyzed samples, i.e. both measured and reference samples.
However, this problem is somewhat mitigated because both the incident and the fluorescence radiation hit the sample at an angle less than 90° and, therefore, the analyzed volume is limited (see Figure 3.4). This means that the sample thickness does not have to be greater than the saturation thickness and in the case of the detection of heavy elements in light matrices, sample thicknesses that are less than the information depth can also generate sample-independent fluorescence intensities in case of an appropriate excitation geometry. Nevertheless, this analyzed sample volume defined by the excitation geometry must also be considered during quantification.
3.2.3 Infinite Thickness
The infinite thickness of a sample is another important parameter to consider, in particular for the analysis of layered samples (see Chapter 14). Like the information depth it depends on the element in question, other elements in the matrix, and the respective measuring geometry but it is largely independent of the spectrometer type. Typical d infiniteis assumed as three times d information, since the usable thickness range cannot be expanded to infinity, because the slope of the calibration curve for thick layers approaches asymptotically the infinite value. Infinite thickness does not mean that no other radiation can penetrate this layer – radiation of higher energy will not completely be absorbed in layers of this thickness. The infinite thickness, for example, of Si is about 15 μm, but only approximately 21% of the fluorescence radiation of Cu will be absorbed in this layer. In the matrix, backscattered Cu radiation can even enhance the fluorescence intensity of Si.
Читать дальшеИнтервал:
Закладка:
Похожие книги на «X-Ray Fluorescence Spectroscopy for Laboratory Applications»
Представляем Вашему вниманию похожие книги на «X-Ray Fluorescence Spectroscopy for Laboratory Applications» списком для выбора. Мы отобрали схожую по названию и смыслу литературу в надежде предоставить читателям больше вариантов отыскать новые, интересные, ещё непрочитанные произведения.


Обсуждение, отзывы о книге «X-Ray Fluorescence Spectroscopy for Laboratory Applications» и просто собственные мнения читателей. Оставьте ваши комментарии, напишите, что Вы думаете о произведении, его смысле или главных героях. Укажите что конкретно понравилось, а что нет, и почему Вы так считаете.