Douglas C. Montgomery - Introduction to Linear Regression Analysis
Здесь есть возможность читать онлайн «Douglas C. Montgomery - Introduction to Linear Regression Analysis» — ознакомительный отрывок электронной книги совершенно бесплатно, а после прочтения отрывка купить полную версию. В некоторых случаях можно слушать аудио, скачать через торрент в формате fb2 и присутствует краткое содержание. Жанр: unrecognised, на английском языке. Описание произведения, (предисловие) а так же отзывы посетителей доступны на портале библиотеки ЛибКат.
- Название:Introduction to Linear Regression Analysis
- Автор:
- Жанр:
- Год:неизвестен
- ISBN:нет данных
- Рейтинг книги:4 / 5. Голосов: 1
-
Избранное:Добавить в избранное
- Отзывы:
-
Ваша оценка:
Introduction to Linear Regression Analysis: краткое содержание, описание и аннотация
Предлагаем к чтению аннотацию, описание, краткое содержание или предисловие (зависит от того, что написал сам автор книги «Introduction to Linear Regression Analysis»). Если вы не нашли необходимую информацию о книге — напишите в комментариях, мы постараемся отыскать её.
New exercises and data sets New material on generalized regression techniques The inclusion of JMP software in key areas Carefully condensing the text where possible
skillfully blends theory and application in both the conventional and less common uses of regression analysis in today's cutting-edge scientific research. The text equips readers to understand the basic principles needed to apply regression model-building techniques in various fields of study, including engineering, management, and the health sciences.
Introduction to Linear Regression Analysis — читать онлайн ознакомительный отрывок
Ниже представлен текст книги, разбитый по страницам. Система сохранения места последней прочитанной страницы, позволяет с удобством читать онлайн бесплатно книгу «Introduction to Linear Regression Analysis», без необходимости каждый раз заново искать на чём Вы остановились. Поставьте закладку, и сможете в любой момент перейти на страницу, на которой закончили чтение.
Интервал:
Закладка:
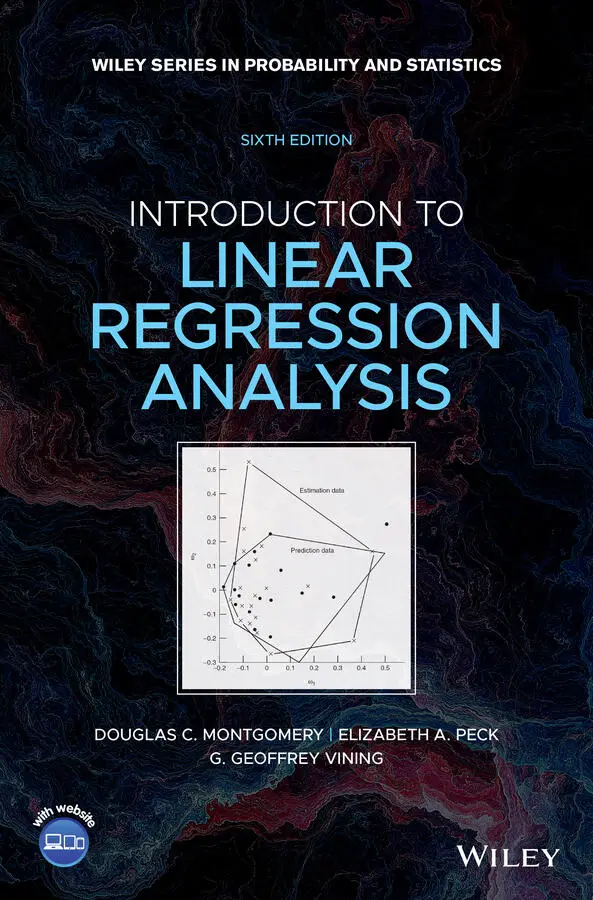
 .Figure 3.16 Plot of y versus x 1.
4 Chapter 4Figure 4.1 Example of a pure leverage point.Figure 4.2 Example of an influential point.Figure 4.3 Normal probability plots: ( a ) ideal; ( b ) light-tailed distribution;...Figure 4.4 Normal probability plot of the externally studentized residuals for...Figure 4.5 Patterns for residual plots: ( a ) satisfactory; ( b ) funnel; ( c ) doub...Figure 4.6 Plot of externally studentized residuals versus predicted for the d...Figure 4.7 Plot of externally studentized residuals versus the regressors for ...Figure 4.8 Prototype residual plots against time displaying autocorrelation in...Figure 4.9 Partial regression plots for the delivery time data.Figure 4.10 Plot of xi versus xj .Figure 4.11 Plot of regressor x 1(cases) versus regressor x 2(distance for the...Figure 4.12 Plot of externally studentized residuals by site (city) for the de...Figure 4.13 Externally studentized residual plots for the rocket propellant da...Figure 4.14 Residual plots for the rocket propellant data with observations 5 ...Figure 4.15 Data illustrating lack of fit of the straight-line model.Figure 4.16 JMP output for the simple linear regression model relating satisfa...
5 Chapter 5Figure 5.1 Scatter diagram of the energy demand (kW) versus energy usage (kWh)...Figure 5.2 Plot of R -student values ti versus fitted values  , Example 5.1.Figure 5.3 Plot of R -student values ti versus fitted values
  for the transfor...Figure 5.4 Linearizable functions. (From Daniel and Wood [1980], used with per...Figure 5.5 Plot of DC output y versus wind velocity x for the windmill data.Figure 5.6 Plot of residuals ei versus fitted values
  for the windmill data....Figure 5.7 Plot of DC output versus x ′ = 1/ x for the windmill data.Figure 5.8 Plot of R -student values ti versus fitted values
  for the transfor...Figure 5.9 Plot of residual sum of squares SS Res(λ) versus λ.Figure 5.10 Plot of ordinary least-squares residuals versus fitted values, Exa...Figure 5.11 Plot of weighted residuals
  versus weighted fitted values
  , Exam...Figure 5.12 JMP results for the delivery time data treating city as a random e...
6 Chapter 6Figure 6.1 An example of a leverage point.Figure 6.2 An example of an influential observation.
7 Chapter 7Figure 7.1 An example of a quadratic polynomial.Figure 7.2 Danger of extrapolation.Figure 7.3 Scatterplot of data, Example 7.1.Figure 7.4 Plot of residuals ei , versus fitted values  , Example 7.1.Figure 7.5 Normal probability plot of the residuals, Example 7.1.Figure 7.6 Scatterplot of voltage drop data.Figure 7.7 Plot of residuals ei , versus fitted values
  for the cubic spline m...Figure 7.8 Plot of residuals ei , versus fitted values
  for the cubic polynomi...Figure 7.9 Piecewise linear regression: ( a ) discontinuity at the knot; ( b ) con...Figure 7.10 The loess fit to the windmill data from SAS.Figure 7.11 The loess fit to the windmill data from JMP.Figure 7.12 The residuals versus fitted values for the loess fit to the windmi...Figure 7.13 The normal probability plot of the residuals for the loess fit to ...Figure 7.14 Central composite design for the chemical process example.Figure 7.15 Normal probability plot of the studentized residuals, chemical pro...Figure 7.16 Plot of studentized residuals versus predicted conversion, chemica...Figure 7.17 Plot of the studentized residuals run order, chemical process exam...Figure 7.18 ( a ) Response surface of predicted conversion. ( b ) Contour plot of ...Figure 7.19 ( a ) Response surface plot of
  . ( b ) Contour plot of
  .
.
8 Chapter 8Figure 8.1 Response functions for the tool life example.Figure 8.2 Plot of tool life y versus lathe speed x 1for tool types A and B.Figure 8.3 Plot of externally studentized residuals t versus fitted values  , ...Figure 8.4 Normal probability plot of externally studentized residuals, Exampl...Figure 8.5 Response functions for Eq. (8.4).
9 Chapter 9Figure 9.1 Levels of family income and house size for a study on residential e...Figure 9.2 Contact time versus reactor temperature, acetylene data. (From Marq...Figure 9.3 Predictions of percentage of conversion within the range of the dat...Figure 9.4 Sampling distribution of ( a ) unbiased and ( b ) biased estimators of Figure 9.5 Ridge trace for acetylene data using nine regressors.Figure 9.6 Performance of the ridge model with k = 0.032 in prediction and ext...Figure 9.7 A geometrical interpretation of ridge regression.Figure 9.8 JMP output for ridge regression model for the acetylene data.Figure 9.9 JMP output for LASSO model for the acetylene data.Figure 9.10 JMP output for the elastic net model for the acetylene data.
10 Chapter 10Figure 10.1 Plot of  versus p .Figure 10.2 Plot of MS Res( p ) versus p .Figure 10.3 A Cp plot.Figure 10.4 Plot of
  versus p , Example 10.1.Figure 10.5 Plot of MS Res( p ) versus p , Example 10.1.Figure 10.6 The Cp plot for Example 10.1.Figure 10.7 JMP computer output for all possible regressions, Hald Cement Data...Figure 10.8 Forward selection results from Minitab for the Hald cement data.Figure 10.9 Backward selection results from Minitab for the Hald cement data....Figure 10.10 Stepwise selection results from Minitab for the Hald cement data....Figure 10.11 Flowchart of the model-building process.Figure 10.12 Normal probability plot of the residuals for the asphalt data.Figure 10.13 Residuals versus the fitted values for the asphalt data.Figure 10.14 Residuals versus the log of the viscosity for the asphalt data.Figure 10.15 Residuals versus surface for the asphalt data.Figure 10.16 Residuals versus base for the asphalt data.Figure 10.17 Residuals versus run for the asphalt data.Figure 10.18 Residuals versus fines for the asphalt data.Figure 10.19 Residuals versus voids for the asphalt data.Figure 10.20 Normal probability plot of the residuals for the asphalt data aft...Figure 10.21 Residuals versus the fitted values for the asphalt data after the...Figure 10.22 Residuals versus the log of the viscosity for the asphalt data af...Figure 10.23 Residuals versus surface for the asphalt data after the log trans...Figure 10.24 Residuals versus base for the asphalt data after the log transfor...Figure 10.25 Residuals versus run for the asphalt data after the log transform...Figure 10.26 Residuals versus fines for the asphalt data after the log transfo...Figure 10.27 Residuals versus voids for the asphalt data after the log transfo...
Интервал:
Закладка:
Похожие книги на «Introduction to Linear Regression Analysis»
Представляем Вашему вниманию похожие книги на «Introduction to Linear Regression Analysis» списком для выбора. Мы отобрали схожую по названию и смыслу литературу в надежде предоставить читателям больше вариантов отыскать новые, интересные, ещё непрочитанные произведения.


Обсуждение, отзывы о книге «Introduction to Linear Regression Analysis» и просто собственные мнения читателей. Оставьте ваши комментарии, напишите, что Вы думаете о произведении, его смысле или главных героях. Укажите что конкретно понравилось, а что нет, и почему Вы так считаете.