Administrative Records for Survey Methodology
Здесь есть возможность читать онлайн «Administrative Records for Survey Methodology» — ознакомительный отрывок электронной книги совершенно бесплатно, а после прочтения отрывка купить полную версию. В некоторых случаях можно слушать аудио, скачать через торрент в формате fb2 и присутствует краткое содержание. Жанр: unrecognised, на английском языке. Описание произведения, (предисловие) а так же отзывы посетителей доступны на портале библиотеки ЛибКат.
- Название:Administrative Records for Survey Methodology
- Автор:
- Жанр:
- Год:неизвестен
- ISBN:нет данных
- Рейтинг книги:3 / 5. Голосов: 1
-
Избранное:Добавить в избранное
- Отзывы:
-
Ваша оценка:
Administrative Records for Survey Methodology: краткое содержание, описание и аннотация
Предлагаем к чтению аннотацию, описание, краткое содержание или предисловие (зависит от того, что написал сам автор книги «Administrative Records for Survey Methodology»). Если вы не нашли необходимую информацию о книге — напишите в комментариях, мы постараемся отыскать её.
Discusses important administrative data issues and suggests how administrative data can be integrated with more traditional surveys Describes practical uses of administrative records for evidence-driven decisions in both public and private sectors Emphasizes using interdisciplinary methodology and linking administrative records with other data sources Explores techniques to leverage administrative data to improve the survey frame, reduce nonresponse follow-up, assess coverage error, mesaure linkage non-consent bias, and perform small area estimation.
Administrative Records for Survey Methodology
Administrative Records for Survey Methodology — читать онлайн ознакомительный отрывок
Ниже представлен текст книги, разбитый по страницам. Система сохранения места последней прочитанной страницы, позволяет с удобством читать онлайн бесплатно книгу «Administrative Records for Survey Methodology», без необходимости каждый раз заново искать на чём Вы остановились. Поставьте закладку, и сможете в любой момент перейти на страницу, на которой закончили чтение.
Интервал:
Закладка:
In addition to noise infusion, the QWI confidentiality protection system uses weighing, which introduces an additional difference between the confidential data item and the released data item. Finally, when a statistic meant to be published turns out to be based on data from fewer than three persons or establishments, it is suppressed. Suppression is only used when the combination of noise infusion and weighing may not distort the publication data with a high enough probability to meet the criteria laid out above; however the suppression rate is much lower than in comparable tabular publications, such as the QCEW. 5 An alternative to suppression (proposed by Gittings 2009; Abowd et al. 2012) uses a synthetic data model that replaces suppressed values with samples drawn from an appropriate PPD. The hybrid system incorporating both noise-infused and synthetic data allows the release of data without suppressions. The confidentiality protection provided by the hybrid system without suppressions is comparable to the protection afforded by the system using the noise infusion system with suppressions, but the analytical validity of the data produced by the hybrid system is improved because the synthetic data are better than the best inference an external user can make regarding the suppressions (Gittings 2009).
The LODES provides aggregated information on where workers are employed (Destinations) and where they live (Origins), along with the characteristics of those places. As the name implies, the data are intended for use in understanding commuting patterns and the nature of local labor markets. The fundamental geographic unit in LODES is a Census block, and thus much more detailed than QWI for which data are published as county-level aggregates. LODES is tabulated from the same microdata as the QWI, and for workplaces (the destination), uses a variation of the QWI noise infusion technique. Cells that do not meet the publication criteria of the QWI continue to be suppressed in LODES, but are replaced using synthetic data. 6 For residences (the origin), the protection system relies on a provably-private synthetic data model (Machanavajjhala et al. 2008). A statistical model is built from the data, as the PPD of release data X ′ given the confidential data X : Pr[ X ′| X ]. Synthetic data points are sampled from the model X ′ , and released . In general, to satisfy differential privacy (Dwork 2006; Dwork et al. 2006, 2017), the amount of noise that must be injected into the synthetic data model is quite large, typically rendering the releasable data of low utility. The novelty of the LODES protection system was to introduce the concept of “probabilistic differential privacy,” and early variant of what are now called approximate differential privacy systems. By allowing the differential privacy guarantee (parametrized by ε ) to fail in certain rare cases (which occur with probability δ ), ( ɛ , δ )-probabilistic differential privacy (Machanavajjhala et al. 2008) improves the analytical validity of the data greatly. LODES uses Census tract-to-tract relations to estimate the PPD for the block-to-block model. A unique model is estimated for each block, recovering the likelihood of a place of residence conditional on place of work and characteristics of the workers and the workplaces. Several additional measures further improve the privacy and analytical validity of the model (see Machanavajjhala et al. 2008 for further details). The resulting privacy-preserving algorithm guarantees ɛ -differential privacy of 8.99 with 99.999 999% confidence ( δ = 10 −6).
2.3.3.3 Disclosure Avoidance Assessment for QWI
The extent of the protection of the QWI micro-data can be measured in two ways: showing the percentage deviation as a measure of the uncertainty about the true value that one can infer from the released value, and the amount of reallocation of small cells (less than five entities in a tabulation cell). 7 Each cell underlying the tabulation is for a statistic X ktwhere k is a cell defined by a combination of age, gender, industry, and county, and for all released time periods for the states at the time of these experiments. 8 The interested reader may find an example assessment in table 1 of Abowd, Schmutte, and Vilhuber (2018) undistorted, unweighted data.
2.3.3.4 Analytical Validity Assessment for QWI
The noise infusion algorithm for QWI is designed to preserve validity of the data for particular analysis tasks. We demonstrate analytical validity using two statistics: time-series properties of the distorted data relative to the confidential data of several estimates, and the cross-sectional unbiasedness of the published data for beginning-of-quarter employment B . The unit of analysis is an interior substate geography × industry × age × sex cell kt . 9 Analytical validity is obtained when the data display no bias and the additional dispersion due to the confidentiality protection system can be quantified so that statistical inferences can be adjusted to accommodate it.
Time-Series Properties of Distorted Data
We estimate an AR(1) for the time series associated with each cell kt . For each cell, the error Δ r = r − r *is computed, where r and r *are the first-order serial correlation coefficient computing using confidential data and protected data, respectively. Table 2.1shows the distribution of the errors Δ r across SIC-division × county cells, for accessions A, beginning-of-quarter employment B, full-quarter employment F, net job flows JF, and separations S (for additional tables, see Abowd et al. 2012). Table 2.1shows that the time series properties of the QWI remain largely unaffected by the distortion. The central tendency of the bias (as measured by the median of the Δ r distribution) is never greater than 0.001, and the error distribution is tight: the semi-interquartile range of the distortion for B in Table 2.1is 0.022, which is less than the precision with which estimated serial correlation coefficients are normally displayed. 10 The overall spread of the distribution is slightly higher when considering two-digit SIC × county and three-digit SIC × county cells (not reported here), due to the greater sparsity. The time series properties of the QWI data are unbiased. The small amount additional noise in the time series statistics is, in general, economically meaningless.
Cross-sectional Unbiasedness of the Distorted Data
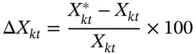
The distribution of the infused noise is symmetric, and allocation of the noise factors is random. The data distribution resulting from the noise infusion should thus be unbiased. We compute the bias Δ X in each cell kt , expressed in percentage terms:
Table 2.1 Distribution of errors Δ r in first-order serial correlation, QWI.
| Variable | Median | Semi-interquartile range |
|---|---|---|
| Accessions | −0.000 542 | 0.026 314 |
| Beginning-of-quarter employment | 0.000 230 | 0.021 775 |
| Full-quarter employment | 0.000 279 | 0.018 830 |
| Net job flows | −0.000 025 | 0.002 288 |
| Separations | 0.000 797 | 0.025 539 |
Evidence of unbiasedness is provided by Figure 2.2, which shows the distribution of the bias for X = B . 11 The distribution of Δ B has most mass around the mode at 0%. Also, as is to be expected, secondary spikes are present around ± c , the inner bound of the noise distribution.
Читать дальшеИнтервал:
Закладка:
Похожие книги на «Administrative Records for Survey Methodology»
Представляем Вашему вниманию похожие книги на «Administrative Records for Survey Methodology» списком для выбора. Мы отобрали схожую по названию и смыслу литературу в надежде предоставить читателям больше вариантов отыскать новые, интересные, ещё непрочитанные произведения.


Обсуждение, отзывы о книге «Administrative Records for Survey Methodology» и просто собственные мнения читателей. Оставьте ваши комментарии, напишите, что Вы думаете о произведении, его смысле или главных героях. Укажите что конкретно понравилось, а что нет, и почему Вы так считаете.