2.3.2.4 Analytical Validity Assessment
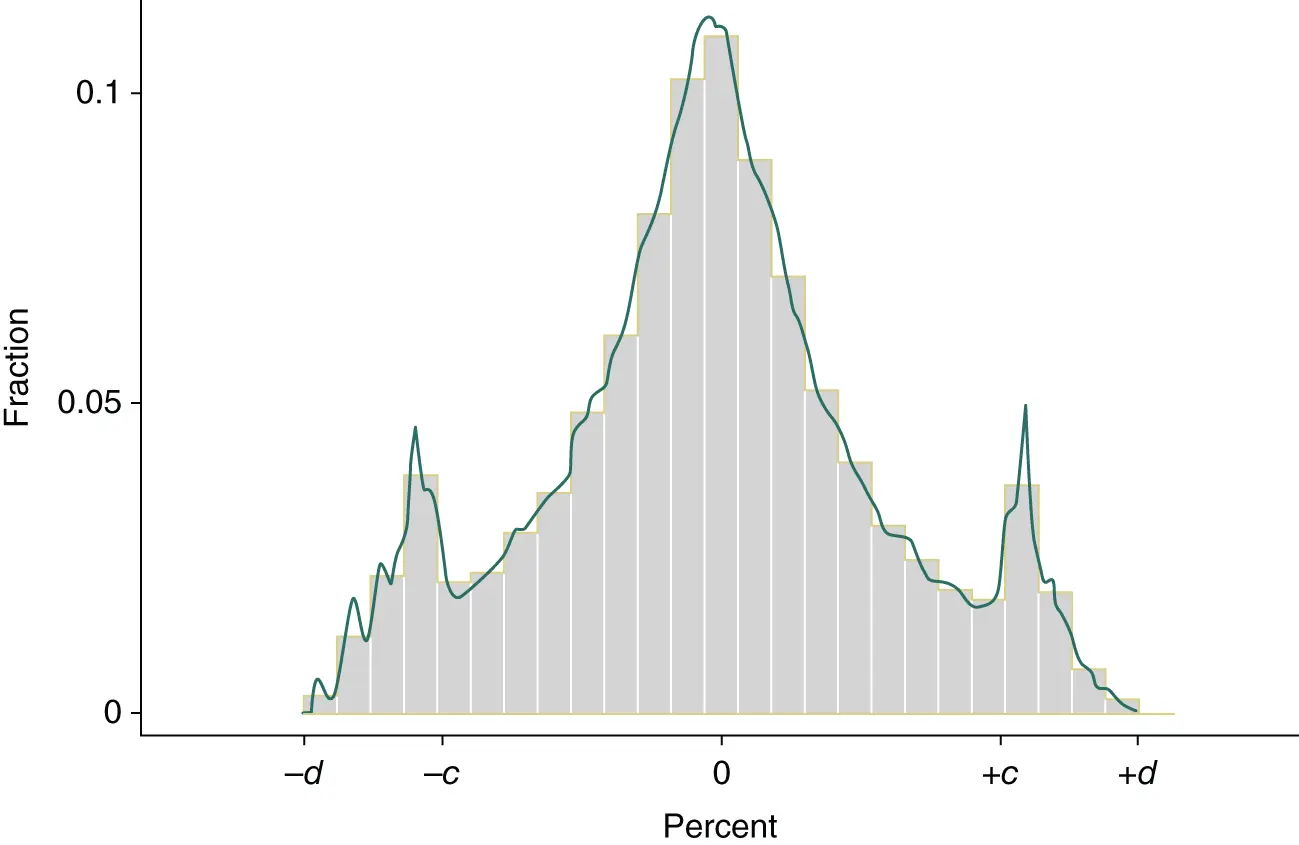
Although synthetic data are designed to solve a confidentiality protection problem, the success of this solution is measured by both the degree of protection provided and the user’s ability to reliably estimate scientifically interesting quantities. The latter property of the synthetic data is known as analytical (or statistical) validity. Analytical validity exists when, at a minimum, estimands can be estimated without bias and their confidence intervals (or the nominal level of significance for hypothesis tests) can be stated accurately (Rubin 1987). To verify analytical validity, the confidence intervals surrounding the point estimates obtained from confidential and synthetic data should completely overlap (Reiter, Oganian, and Karr 2009), presumably with the synthetic confidence interval being slightly larger because of the increased variation arising from the synthesis. When these results are obtained, inferences drawn about the coefficients will be consistent whether one uses synthetic or completed data. The reader interested in detailed examples that show how analytic validity is assessed in the SSB should consult Figures 2.1and 2.2and associated discussion in Abowd, Schmutte, and Vilhuber (2018).
Box 2.1 Sidebox: Practical Synthetic Data Use
The SIPP–SSA–IRS Synthetic Beta File is accessible to users in its current form since 2010. Interested users can request an account by following links at https://www.vrdc.cornell.edu/sds/. Applications are judged solely on feasibility (i.e. the necessary variables are on the SSB). After projects are approved by the Census Bureau, researchers will be given accounts on the Synthetic Data Server. Users can submit validation requests, following certain rules, outlined on the Census Bureau’s website. Deviations from the guidelines may be possible with prior approval of the Census Bureau, but are typically only granted if specialized software is needed (other than SAS or Stata), and only if said software also exists already on Census Bureau computing systems. Between 2010 and 2016, over one hundred users requested access to the server, using a succession of continuously improved datasets.

Figure 2.2 Distribution of Δ B in Maryland. For details, see text.
2.3.3 LEHD: Linked Establishment and Employee Records
2.3.3.1 Data Description
The LEHD data links employee wage records extracted from Unemployment Insurance (UI) administrative files from 51 states with establishment-level records from the Quarterly Census of Employment and Wages (QCEW, also provided by the partner states), the SSA-sourced record of applications for SSNs (“Numident”), residential addresses derived from IRS-provided individual tax filings, and data from surveys and censuses conducted by the U.S. Census Bureau (2000 and 2010 decennial censuses, as well as microdata from the ACS). Additional information is linked in from the Census Bureau’s Employer Business Register and its derivative files. The merged data are subject both to United States Code (U.S.C.) Title 13 and Title 26 protections. For more details, see Abowd, Haltiwanger, and Lane (2004) and Abowd et al. (2009).
From the data, multiple output products are generated. The Quarterly Workforce Indicators (QWI) provide local estimates of a variety of employment and earnings indicators, such as job creation, job destruction, new hires, separations, worker turnover, and monthly earnings, for detailed person and establishment characteristics, such as age, gender, firm age, and firm size (Abowd et al. 2009). The first QWI were released in 2003. The data are used for a variety of analyses and research, emphasizing detailed local data on demographic labor market variables (Gittings and Schmutte 2016; Abowd and Vilhuber 2012). Based on the same input data, the LEHD Origin-Destination Employment Statistics (LODES) describe the geographic distribution of jobs according to the place of employment and the place of worker residence (Center for Economic Studies 2016). New job-to-job flow statistics measure the movement of jobs and workers across industries and regional labor markets (Hyatt et al. 2014). The microdata underlying these products is heavily used in research, since it provides nearly universal coverage of U.S. workers observed at quarterly frequencies. Snapshots of the statistical production database are made available to researchers regularly (McKinney and Vilhuber 2011a,2011b; Vilhuber and McKinney 2014).
2.3.3.2 Disclosure Avoidance Methods
We describe in detail the disclosure avoidance method used for workplace tabulations in QWI and LODES (Abowd et al. 2012). Not discussed here are the additional disclosure avoidance methods applied in advance of publishing data on job flows (Abowd and McKinney 2016). Focusing on QWI and LODES is sufficient to highlight the types of confidentiality concerns that arise from working with these linked data, and the kinds of strategies the Census Bureau uses to address them.
In the QWI confidentiality protection scheme, confidential micro-data are considered protected by noise infusion if one of the following conditions holds: (1) any inference regarding the magnitude of a particular respondent’s data must differ from the confidential quantity by at least c % even if that inference is made by a coalition of respondents with exact knowledge of their own answers (FCSM 2005, p. 72), or (2) any inference regarding the magnitude of an item is incorrect with probability not less than y %, where c and y are confidential but generally “large.” Condition (1) is intended to prevent, say, a group of firms from “backing out” the total payroll of a specific competitor by combining their private information with the published total. Condition (2) prevents inference of counts of the number of workers or firms that satisfy some condition (say, the number of teenage workers employed in the fast food industry in Hull, GA) assuming item suppression or some additional protection, like synthetic data, when the count is too small.
Complying with these conditions involves the application of SDL throughout the data production process. It starts with the job-level data that record characteristics of the employment match between a specific individual and a specific workplace, or establishment, at a specific point in time. When the job-level data are aggregated to the establishment level, the QWI system adds statistical noise. This noise is designed to have three important properties. First, every job-level data point is distorted by some minimum amount. Second, for a given workplace, the data are always distorted in the same direction (increased or decreased) and by the same percentage magnitude in every period. Third, when the estimates are aggregated, the distortions added to individual data points tend to cancel out in a manner that preserves the cross-sectional and time-series properties of the data. The chosen distribution is a ramp distribution centered on unity, with a distortion of at least a % and at most b % ( Figure 2.1).
All published data from QWI use the same noise-distorted data, and any special tabulations released from the QWI must follow the same procedures. The QWI system extends the idea of multiplicative noise infusion as a cross-sectional confidentiality protection mechanism first proposed by Evans, Zayatz, and Slanta (1998). A similar noise-infusion process has been used since 2007 to protect the confidentiality of data underlying the Census Bureau’s CBP (Massell and Funk 2007) and was tested for application to the Commodity Flow Survey (Massell, Zayatz, and Funk 2006).
Читать дальше


