Daniel J. Denis - Applied Univariate, Bivariate, and Multivariate Statistics
Здесь есть возможность читать онлайн «Daniel J. Denis - Applied Univariate, Bivariate, and Multivariate Statistics» — ознакомительный отрывок электронной книги совершенно бесплатно, а после прочтения отрывка купить полную версию. В некоторых случаях можно слушать аудио, скачать через торрент в формате fb2 и присутствует краткое содержание. Жанр: unrecognised, на английском языке. Описание произведения, (предисловие) а так же отзывы посетителей доступны на портале библиотеки ЛибКат.

- Название:Applied Univariate, Bivariate, and Multivariate Statistics
- Автор:
- Жанр:
- Год:неизвестен
- ISBN:нет данных
- Рейтинг книги:5 / 5. Голосов: 1
-
Избранное:Добавить в избранное
- Отзывы:
-
Ваша оценка:
Applied Univariate, Bivariate, and Multivariate Statistics: краткое содержание, описание и аннотация
Предлагаем к чтению аннотацию, описание, краткое содержание или предисловие (зависит от того, что написал сам автор книги «Applied Univariate, Bivariate, and Multivariate Statistics»). Если вы не нашли необходимую информацию о книге — напишите в комментариях, мы постараемся отыскать её.
contains an accessible introduction to statistical modeling techniques commonly used in the social and behavioral sciences. The text offers a blend of statistical theory and methodology and reviews both the technical and theoretical aspects of good data analysis.
Featuring applied resources at various levels, the book includes statistical techniques using software packages such as R and SPSS®. To promote a more in-depth interpretation of statistical techniques across the sciences, the book surveys some of the technical arguments underlying formulas and equations. The thoroughly updated edition includes new chapters on nonparametric statistics and multidimensional scaling, and expanded coverage of time series models. The second edition has been designed to be more approachable by minimizing theoretical or technical jargon and maximizing conceptual understanding with easy-to-apply software examples. This important text:
Offers demonstrations of statistical techniques using software packages such as R and SPSS® Contains examples of hypothetical and real data with statistical analyses Provides historical and philosophical insights into many of the techniques used in modern social science Includes a companion website that includes further instructional details, additional data sets, solutions to selected exercises, and multiple programming options Written for students of social and applied sciences,
offers a text to statistical modeling techniques used in social and behavioral sciences.
Applied Univariate, Bivariate, and Multivariate Statistics — читать онлайн ознакомительный отрывок
Ниже представлен текст книги, разбитый по страницам. Система сохранения места последней прочитанной страницы, позволяет с удобством читать онлайн бесплатно книгу «Applied Univariate, Bivariate, and Multivariate Statistics», без необходимости каждый раз заново искать на чём Вы остановились. Поставьте закладку, и сможете в любой момент перейти на страницу, на которой закончили чтение.
Интервал:
Закладка:
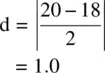
As an example, where  , μ 0= 18, and σ = 2 Cohen's d is computed as:
Cohen offered the guidelines of 0.20, 0.50, and 0.80 as representing small, medium, and large effects respectively (Cohen, 1988). However, relying on effect size guidelines to indicate the absolute size of an experimental or nonexperimental effect should only be done in the complete and absolute absence of all other information for the research area. In the end, it is the researcher, armed with knowledge of the history of the phenomenon under study, who must evaluate whether an effect is small or large. For instance, referring to the achievement example discussed earlier, Cohen's d would be equal to:
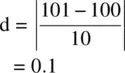
The effect size of 0.1 is small according to Cohen's guidelines, but more importantly, also small substantively, since a difference in means of 1 point is, by all accounts, likely trivial. In this case, both Cohen's guidelines and the actual substantive evaluation of the size of effect coincide. However, this is not always the case. In physical or biological experiments, for instance, one can easily imagine examples for which an effect size of even 0.8 might be considered “small” relative to the research area under investigation, since the degree of control the investigator can impose over his or her subjects is much greater. In such cases, it may very well be that Cohen's d values in the neighborhood of two or three would be required for an effect to be considered “large.” The point is that only in the complete absence of information regarding an area of investigation is it appropriate to use “rules of thumb” to evaluate the size of effect. Cohen's d, or effect size measures in general, should always be used in conjunction with statements of statistical significance, since they tell the researcher what she is actually wanting to know, that of the estimated separation between sample data (often in the form of a sample mean) and the null hypothesis under investigation. Oftentimes meta‐analysis, which is a study of the overall measure of effect for a given phenomenon, can be helpful in comparing new research findings to the “status quo” in a given field. For a thorough user‐friendly overview of the methodology, consult Shelby and Vaske (2008).
2.28.7 What Does Cohen's d Actually Tell Us?
Writing out a formula and plugging in numbers, unfortunately, does not necessarily give us a feeling for what the formula actually means. This is especially true with regard to Cohen's d. We now discuss the statistic in a bit more detail, pointing out why it is usually interpreted as the standardized difference between means.
Imagine you have two independent samples of laboratory rats. To one sample, you provide normal feeding and observe their weight over the next 30 days. To the other sample, you also feed normally, but also give them regular doses of a weight‐loss drug. You are interested in learning whether your weight‐loss drug works or not. Suppose that after 30 days, on average, a mean difference of 0.2 pounds is observed between groups. How big is a difference of 0.2 pounds for these groups? If the average difference in weight among rats in the population were very large, say, 0.8 pounds, then a mean difference of 0.2 pounds is not that impressive. After all, if rats weigh very differently from one rat to the next, then really, finding a mean difference of 0.2 between groups cannot be that exciting. However, if the average weight difference between rats were equal to 0.1 pounds, then all of a sudden, a mean difference of 0.2 pounds seems more impressive, because that size of difference is atypicalrelative to the population. What is “typical?” This is exactly what the standard deviationreveals. Hence, when we are computing Cohen's d, we are in actuality producing a ratio of one deviation relative to another, similar to how when we compute a z ‐score, we are comparing the deviation of y − μ with the standarddeviation σ . The extent to which observed differences are large relative to “average” differences will be the extent to which d will be large in magnitude.
2.28.8 Why and Where the Significance Test Still Makes Sense
At this point, the conscientious reader may very well be asking the following question: If the significance test is so misleading and subject to misunderstanding and misinterpretation, how does it even make sense as a test of anything? It would appear to be a nonsensical test and should forever be forgotten. The fact is that the significance test doesmake sense, only that the sense that it makes is not necessarily always scientific. Rather, it is statistical. To a pure theoretical statistician or mathematician, a decreasing p ‐value as a function of an increasing sample size makes perfect sense—as we snoop a larger part of the population, the random error we expect typically decreases, because with each increase in sample size we are obtaining a better estimate of the true population parameter. Hence, that we achieve statistical significance with a sample size of 500 and not 100, for instance, is well within that of statistical “good sense.” That is, the p‐value is functioning as it should, and likewise yielding the correct statisticalinformation.
However, statistical truth does not equate to scientific truth(Bolles, 1962). Statistical conclusions should never be automatically equated with scientific ones. They are different and distinct things. When we arrive at a statistical conclusion (e.g., when deciding to reject the null hypothesis), one can never assume that this represents anything that is necessarily or absolutely scientifically meaningful. Rather, the statistical conclusion should be used as a potential indicatorthat something scientifically interesting mayhave occurred, the evidence for which must be determined by other means, which includes effect sizes, researcher judgment, and putting the obtained result into its proper interpretive context.
2.29 CHAPTER SUMMARY AND HIGHLIGHTS
To understand advanced statistical procedures, it is necessary to have a firm grasp on the foundations of introductory statistics. Advanced procedures are typically extensions of first principles.
Densities are theoretical probability distributions. The normal univariate density is an example.
The standard normal distribution has a mean μ of 0 and a variance σ2 of 1.
z‐scores are useful for comparing raw scores emanating from different distributions. Standardization transforms raw scores to a common scale, allowing for comparison between scores.
Binomial distributions are useful in modeling experiments in which the outcome can be conceptualized as a “success” or “failure.” The outcome of the experiment must be binary in nature for the binomial distribution to apply.
The normal distribution can be used to approximate the binomial distribution. In this regard, we say that the limiting form of the binomial distribution is the normal distribution.
Читать дальшеИнтервал:
Закладка:
Похожие книги на «Applied Univariate, Bivariate, and Multivariate Statistics»
Представляем Вашему вниманию похожие книги на «Applied Univariate, Bivariate, and Multivariate Statistics» списком для выбора. Мы отобрали схожую по названию и смыслу литературу в надежде предоставить читателям больше вариантов отыскать новые, интересные, ещё непрочитанные произведения.


Обсуждение, отзывы о книге «Applied Univariate, Bivariate, and Multivariate Statistics» и просто собственные мнения читателей. Оставьте ваши комментарии, напишите, что Вы думаете о произведении, его смысле или главных героях. Укажите что конкретно понравилось, а что нет, и почему Вы так считаете.