The Handbook of Speech Perception
Здесь есть возможность читать онлайн «The Handbook of Speech Perception» — ознакомительный отрывок электронной книги совершенно бесплатно, а после прочтения отрывка купить полную версию. В некоторых случаях можно слушать аудио, скачать через торрент в формате fb2 и присутствует краткое содержание. Жанр: unrecognised, на английском языке. Описание произведения, (предисловие) а так же отзывы посетителей доступны на портале библиотеки ЛибКат.
- Название:The Handbook of Speech Perception
- Автор:
- Жанр:
- Год:неизвестен
- ISBN:нет данных
- Рейтинг книги:4 / 5. Голосов: 1
-
Избранное:Добавить в избранное
- Отзывы:
-
Ваша оценка:
The Handbook of Speech Perception: краткое содержание, описание и аннотация
Предлагаем к чтению аннотацию, описание, краткое содержание или предисловие (зависит от того, что написал сам автор книги «The Handbook of Speech Perception»). Если вы не нашли необходимую информацию о книге — напишите в комментариях, мы постараемся отыскать её.
, Second Edition, is a comprehensive and up-to-date survey of technical and theoretical developments in perceptual research on human speech. Offering a variety of perspectives on the perception of spoken language, this volume provides original essays by leading researchers on the major issues and most recent findings in the field. Each chapter provides an informed and critical survey, including a summary of current research and debate, clear examples and research findings, and discussion of anticipated advances and potential research directions. The timely second edition of this valuable resource:
Discusses a uniquely broad range of both foundational and emerging issues in the field Surveys the major areas of the field of human speech perception Features newly commissioned essays on the relation between speech perception and reading, features in speech perception and lexical access, perceptual identification of individual talkers, and perceptual learning of accented speech Includes essential revisions of many chapters original to the first edition Offers critical introductions to recent research literature and leading field developments Encourages the development of multidisciplinary research on speech perception Provides readers with clear understanding of the aims, methods, challenges, and prospects for advances in the field
, Second Edition, is ideal for both specialists and non-specialists throughout the research community looking for a comprehensive view of the latest technical and theoretical accomplishments in the field.
The Handbook of Speech Perception — читать онлайн ознакомительный отрывок
Ниже представлен текст книги, разбитый по страницам. Система сохранения места последней прочитанной страницы, позволяет с удобством читать онлайн бесплатно книгу «The Handbook of Speech Perception», без необходимости каждый раз заново искать на чём Вы остановились. Поставьте закладку, и сможете в любой момент перейти на страницу, на которой закончили чтение.
Интервал:
Закладка:
When we speak, the different types of sound sources, whether unvoiced noises or voiced harmonic series, are shaped by resonances in the vocal tract, which we must deftly manipulate by dynamically changing the volume and the size of the openings of a number of cavities in our throat, mouth, and nose, which we do by articulatory movements of the jaw, soft palate, tongue, and lips. The resonances in our vocal tracts impose broad spectral peaks on the spectra of the speech sounds, and these broad spectral peaks are known as formants. The dynamic pattern of changing formant frequencies encodes the lion’s share of the semantic information in speech. Consequently, to interpret a speech stream that arrives at our ears, one might think that our ears and brains will chiefly need to examine the incoming sounds for broad peaks in the spectrum to identify formants. But, to detect voicing and to determine voice pitch, the brain must also look either for sharp peaks at regular intervals in the spectrum to identify harmonics or, alternatively, for periodicities in the temporal waveform. Pitch information provided by harmonicity or, equivalently, periodicity is a vital cue to help identify speakers, gain prosodic information, or determine the tone of a vowel in tonal languages like Chinese or Thai, which use pitch contours to distinguish between otherwise identical homophonic syllables. Encoding information about these fundamental features, formants, and harmonicity or periodicity, is thus an essential job of the inner ear and auditory nerve. They do this as they translate incoming sound waveforms into a tonotopically organized pattern of neural activity, which represents differences in acoustic energy across frequency bands by means of a so‐called rate–place code. Nerve fibers that are tuned to systematically different preferred, or characteristic, frequencies are arranged in an orderly array. Differences in firing rates across the array encode peaks and valleys in the frequency spectrum, which conveys information about formants and, to a lesser extent, harmonics.
This concept of tonotopy is quite central to the way all sounds, not just speech sounds, are usually thought to be represented along the lemniscal auditory pathway. All the stations of the lemniscal auditory pathway shown in Figure 3.1, from the cochlea to the primary auditory cortex, contain at least one, and sometimes several tonotopic maps , that is, arrays of frequency‐tuned neurons arranged in a systematic array from low to high preferred frequency. It is therefore worth examining this notion of tonotopy in some detail to understand its origin, and to ask what tonotopy can and cannot do to represent fundamental features of speech.
In the mammalian brain, tonotopy arises quite naturally from the way in which sounds are transduced into neural responses by the basilar membrane and organ of corti in the cochlea. When sounds are transmitted from the ear drum to the inner ear via the ossicles, the mechanical vibrations are transmitted to the basilar membrane via fluid‐filled chambers of the inner ear. The basilar membrane itself has a stiffness gradient, being stiff at the basal end, near the ossicles, and floppy at the far end, the apex. Sounds transmitted through the far end have little mechanical resistance from the stiffness of the basilar membrane, but have to displace more inert fluid column in the inner ear. Sounds traveling through the near end face less inertia, but more stiffness. The upshot of this is that one can think of the basilar membrane as a bank of mechanical spring‐mass filters, with filters tuned to high frequencies at the base, and to increasingly lower frequencies toward the apex. Tiny, highly sensitive hair cells that sit on the basilar membrane then pick up these frequency‐filtered vibrations and translate them into electrical signals, which are then encoded as trains of nerve impulses (also called action potentials or spikes) in the bundles of auditory nerve fibers that connect the inner ear to the brain. Thus, each nerve fiber in the auditory nerve is frequency tuned, and the sound frequency it is most sensitive to is known as its characteristic frequency (CF).
The cochlea, and the basilar membrane inside it, is curled up in a spiral, and the organization of the auditory nerve mirrors that of the basilar membrane: inside it we have something that could be described as a rate–place code for sounds, where the amount of sound energy at the lowest audible frequencies (around 50 Hz) is represented by the firing rates of nerve fibers right at the center, and increasingly higher frequencies are encoded by nerve fibers that are arranged in a spiral around that center. Once the auditory nerve reaches the cochlear nuclei, this orderly spiral arrangement unwraps to project systematically across the extent of the nuclei, creating tonotopic maps, which are then passed on up the auditory pathway by orderly anatomical connections from one station to the next. What this means for the encoding of speech in the early auditory system is that formant peaks of speech sounds, and maybe also the peaks of harmonics, should be represented by systematic differences in firing rates across the tonotopic array. The human auditory nerve contains about 30,000 such nerve fibers, each capable of firing anywhere between zero and several hundred spikes a second. So there are many hundreds of thousands of nerve impulses per second available to represent the shape of the sound spectrum across the tonotopic array. And, indeed, there is quite a lot of experimental evidence that systematic firing‐rate differences across this array of nerve fibers is not a bad first‐order approximation of what goes on in the auditory system (Delgutte, 1997), but, as so often in neurobiology, the full story is a lot more complicated.
Thanks to decades of physiological and anatomical studies on experimental animals by dozens of teams, the mechanisms of sound encoding in the auditory nerve are now known in sufficient detail that it has become possible to develop computer models that can predict the activity of auditory nerve fibers to arbitrary sound inputs (Zhang et al., 2001; Heinz, Colburn, & Carney, 2002; Sumner et al., 2002; Meddis & O’Mard, 2005; Zhang & Carney, 2005; Ferry & Meddis, 2007), and here we shall use the model of Zilany, Bruce, and Carney (2014) to look at the encoding of speech sounds in the auditory nerve in a little more detail.
The left panel of Figure 3.2shows the power spectrum of a recording of the spoken vowel [ɛ], as in head (IPA [hɛːd]). The spectrum shows many sharp peaks at multiples of about 145 Hz – the harmonics of the vowel. These sharp peaks ride on top of broad peaks centered around 500, 1850, and 2700 Hz – the formants of the vowel. The right panel of the figure shows the distribution of firing rates of low spontaneous rate (LSR) auditory nerve fibers in response to the same vowel, according to the auditory nerve fiber model by Zilany, Bruce, and Carney (2014). Along the x‐axis we plot the CF of each nerve fiber, and along the y‐axis we expect the average number of spikes the fiber would be expected to fire per second when presented with the vowel [ɛ] at a sound level of 65 dB SPL (sound pressure level), the sort of sound level that would be typical during a calm conversation with a quiet background.
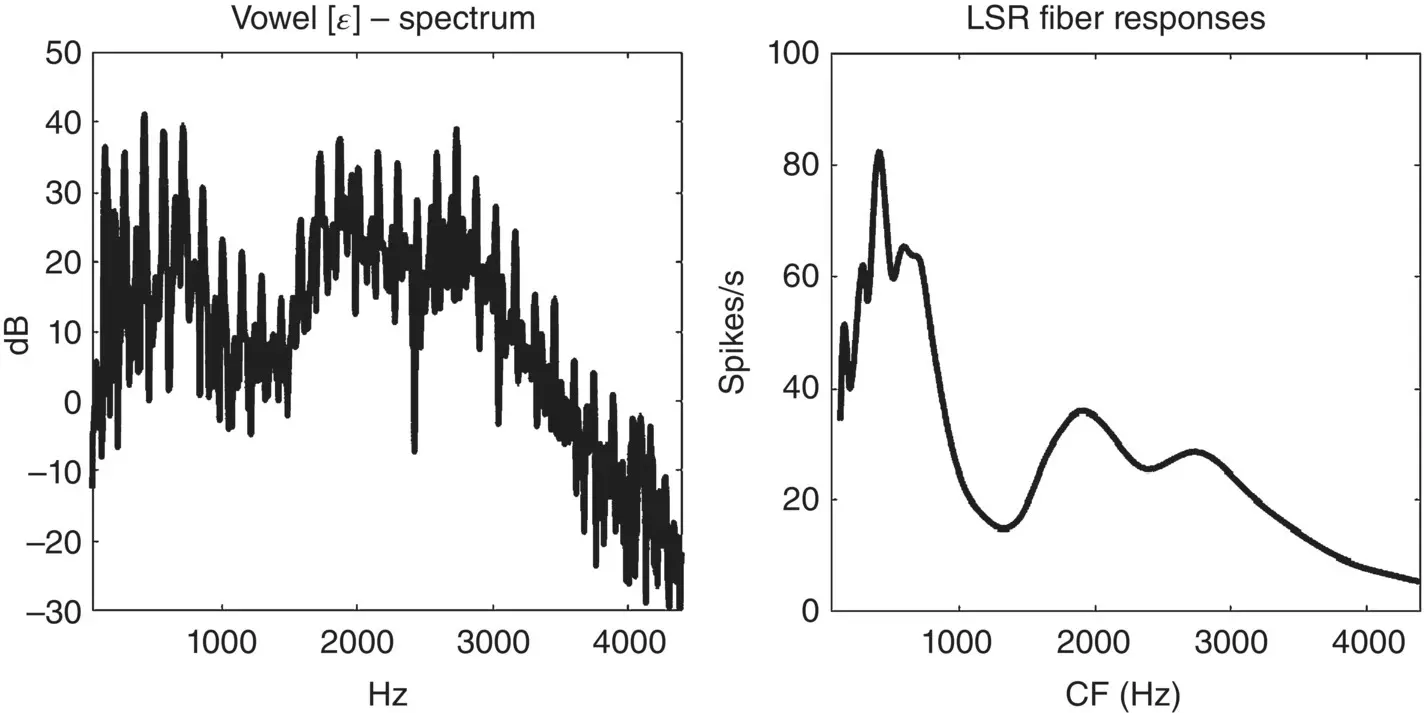
Figure 3.2 A power spectrum representing an instantaneous spectrogram (left) and a simulated distribution of firing rates for an auditory nerve fiber (right) for the vowel [ɛ] in head [hɛːd].
Comparing the spectrogram on the left with the distribution of firing rates on the right, it is apparent that the broad peaks of the formants are well reflected in the firing rate distribution, if anything perhaps more visibly than in the spectrum, but that most of the harmonics are not. Indeed, only the lowest three harmonics are visible; the others have been ironed out by the fact that the frequency tuning of cochlear filters is often broad compared to the frequency interval between individual harmonics, and becomes broader for higher frequencies. Only the very lowest harmonics are therefore resolved by the rate–place code of the tonotopic nerve fiber array, and we should think of tonotopy as well adapted to representing formants but poorly adapted to representing pitch or voicing information. If you bear in mind that many telephones will high‐pass filter speech at 300 Hz, thereby effectively cutting off the lowest harmonic peak, there really is not much information about the harmonicity of the sound left reflected in the tonotopic firing‐rate distribution. But there are important additional cues to voicing and pitch, as we shall see shortly.
Читать дальшеИнтервал:
Закладка:
Похожие книги на «The Handbook of Speech Perception»
Представляем Вашему вниманию похожие книги на «The Handbook of Speech Perception» списком для выбора. Мы отобрали схожую по названию и смыслу литературу в надежде предоставить читателям больше вариантов отыскать новые, интересные, ещё непрочитанные произведения.


![О Генри - Справочник Гименея [The Handbook of Hymen]](/books/407356/o-genri-spravochnik-gimeneya-the-handbook-of-hymen-thumb.webp)


Обсуждение, отзывы о книге «The Handbook of Speech Perception» и просто собственные мнения читателей. Оставьте ваши комментарии, напишите, что Вы думаете о произведении, его смысле или главных героях. Укажите что конкретно понравилось, а что нет, и почему Вы так считаете.