Space Physics and Aeronomy, Ionosphere Dynamics and Applications
Здесь есть возможность читать онлайн «Space Physics and Aeronomy, Ionosphere Dynamics and Applications» — ознакомительный отрывок электронной книги совершенно бесплатно, а после прочтения отрывка купить полную версию. В некоторых случаях можно слушать аудио, скачать через торрент в формате fb2 и присутствует краткое содержание. Жанр: unrecognised, на английском языке. Описание произведения, (предисловие) а так же отзывы посетителей доступны на портале библиотеки ЛибКат.
- Название:Space Physics and Aeronomy, Ionosphere Dynamics and Applications
- Автор:
- Жанр:
- Год:неизвестен
- ISBN:нет данных
- Рейтинг книги:4 / 5. Голосов: 1
-
Избранное:Добавить в избранное
- Отзывы:
-
Ваша оценка:
Space Physics and Aeronomy, Ionosphere Dynamics and Applications: краткое содержание, описание и аннотация
Предлагаем к чтению аннотацию, описание, краткое содержание или предисловие (зависит от того, что написал сам автор книги «Space Physics and Aeronomy, Ionosphere Dynamics and Applications»). Если вы не нашли необходимую информацию о книге — напишите в комментариях, мы постараемся отыскать её.
Ionosphere Dynamics and Applications Volume highlights include:9;
Behavior of the ionosphere in different regions from the poles to the equator Distinct characteristics of the high-, mid-, and low-latitude ionosphere Observational results from ground- and space-based instruments Ionospheric impacts on radio signals and satellite operations How earthquakes and tsunamis on Earth cause disturbances in the ionosphere The American Geophysical Union promotes discovery in Earth and space science for the benefit of humanity. Its publications disseminate scientific knowledge and provide resources for researchers, students, and professionals.
Space Physics and Aeronomy, Ionosphere Dynamics and Applications — читать онлайн ознакомительный отрывок
Ниже представлен текст книги, разбитый по страницам. Система сохранения места последней прочитанной страницы, позволяет с удобством читать онлайн бесплатно книгу «Space Physics and Aeronomy, Ionosphere Dynamics and Applications», без необходимости каждый раз заново искать на чём Вы остановились. Поставьте закладку, и сможете в любой момент перейти на страницу, на которой закончили чтение.
Интервал:
Закладка:
While the number of ground‐based GNSS receivers continues to increase and TEC maps of better spatial resolution can be obtained, their imaging capability is limited by the inhomogeneous distribution of the continents. This limitation can be improved by using tomographic reconstruction and data assimilation techniques (e.g., Aa et al., 2016, 2018; Bust & Datta‐Barua, 2014; Bust & Mitchell, 2008; Gardner et al., 2014, 2018; Mannucci et al., 1998; Yin et al., 2008; Yin et al., 2017), which are able to take in heterogeneous ionospheric data sets and combine with a physics‐based or empirical models to best describe the ionosphere density and TEC distributions. For instance, by combing measurements from ground‐based GNSS receivers and LEO satellites, such as COSMIC (Constellation Observing System for Meteorology, Ionospheric, and Climate) and GRACE (Gravity Recovery And Climate Experiment), Yue et al. (2016) obtained the global ionospheric electron density and TEC with the spatial/temporal resolution of 5° in latitude, 10° in longitude, ~30 km around the F 2peak, and 0.5 h in time, during the 17 March 2013 storm. Figure 4.6shows the comparison between the original ground‐based GNSS TEC map and the reconstructed map combining both ground and space‐based measurements. SED and TOI signatures are clear in both plots, but the reconstructed map is able to provide a much more complete picture. This type of method has a huge potential for filling in the large gaps over ocean and would be of great use for studying the ionospheric density distributions on a global scale. For example, during this storm, this method was able to reveal two separate SED/TOI structures in the conjugate hemispheres. In addition to these tomographic reconstruction and data assimilation techniques, new statistical analysis of these TEC maps also reveals new features of the SED/TOI evolution. Yang et al. (2016) statistically analyzed the exit of the SED/TOI plasma and found that they preferentially exit the nightside polar cap in the premidnight sector but join the dawn convection cell, forming a "hook‐like" high‐density pattern.
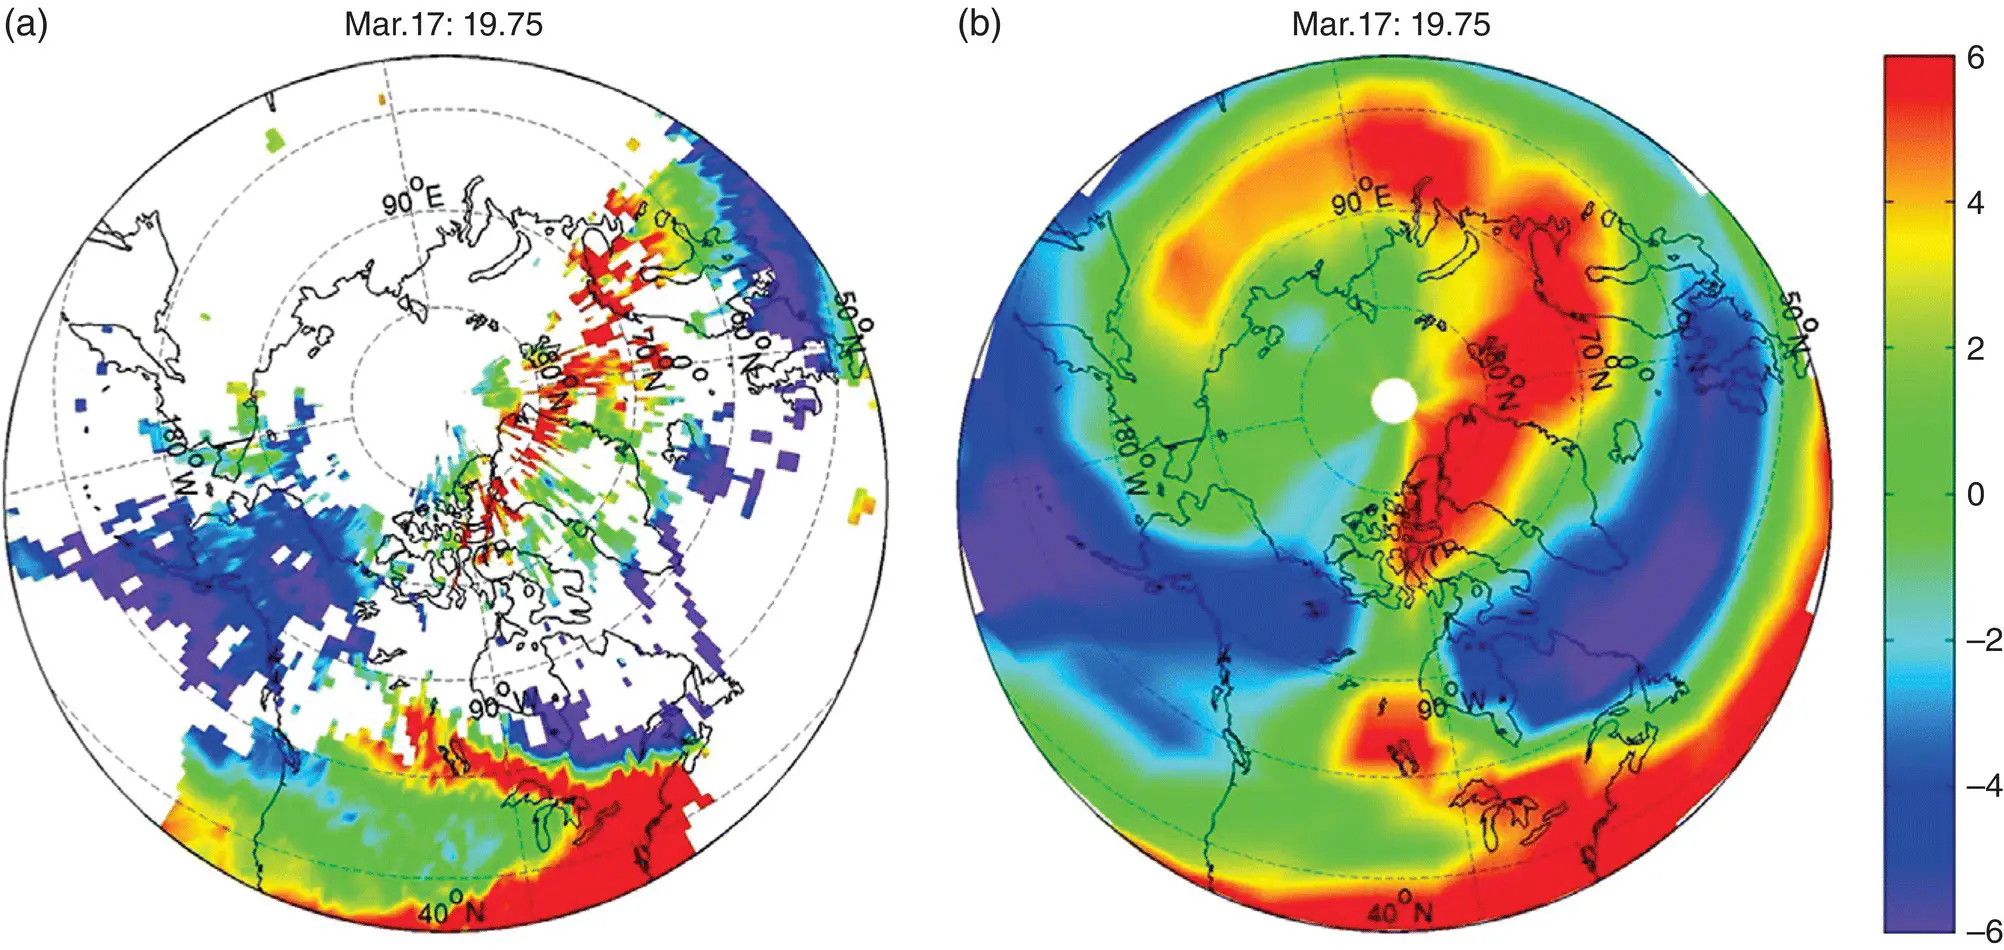
Figure 4.6 (a) TEC map of the Northern Hemisphere using ground‐based receivers only; (b) TEC map results from the reanalysis by combining multiple data sources together
(from Yue et al., 2016; Reproduced with permission of John Wiley and Sons).
In the polar cap region, the Earth's magnetic field is nearly vertical. Thus, the ExB convection flow and the horizontal thermospheric wind cannot efficiently lift or descent the F‐region density structures. Indeed, using the TIEGCM model, Liu et al. (2016) studied the 2015 St. Patrick's Day storms and found that the horizontal transport due to the E×B ion drift plays an essential role in moving plasma from the dayside convection throat region to the polar cap to form plume/TOIs. Similar results have been obtained using the Global Ionosphere and Thermosphere model (GITM) in Zou and Ridley (2016). In their study, SED plume/TOIs in the polar cap region have been traced backward to the subauroral region during the 24–25 October 2011 geomagnetic storm. Simulation results suggest that plasma originating from both the dawn and dusk sectors is able to contribute to the formation of the SED plume in the model. However, the ionospheric plasma originating from different local time sectors can have different properties in terms of the F‐region peak density N mF 2and the peak height h mF 2. Plasma originating from the dawn sector exhibits slow but steady increase in h mF 2, N mF 2, and TEC as the flux tube drifting from lower to higher latitudes, while those from the dusk sector experience more steep increase and decrease in h mF 2and TEC because of larger convection flow variations. This suggests that the h mF 2, together with the TEC value, might provide a means for understanding the origin of the plasma that contributes to formation of the SED plumes.
Several mechanisms have been proposed for segmenting SED plume/TOI entering the polar cap into a patch and reviewed by Carlson (2012). These mechanisms either highlight the variations in the solar wind and IMF, and thus high‐latitude convection electric field, or ion‐neutral interactions in the region of large electric fields (Anderson et al., 1988; Lockwood & Carlson, 1992; Rodger et al., 1994; Valladares et al., 1996, 1998; Zhang et al., 2013a). One mechanism, transient reconnection, is accompanied by soft electron precipitation from the magnetosheath. The precipitating electrons can cause ionization and heat the cusp plasma. Patches created by this mechanism are found to have lower density and lower optical luminosity (Hosokawa et al., 2016; Oksavik et al., 2006; Zhang et al., 2013b) than those originated from the dayside solar EUV‐produced plasma. Periodic poleward‐moving auroral forms (PMAFs) produced by those precipitating soft electrons shown in Hosokawa et al. (2016) only reached ~150 R, which is lower than the typical patch luminosity on the nightside (Hosokawa et al., 2006). In the future, it may be more sensible to treat the relatively low‐density patches and higher‐density patches separately, since they might be produced by different mechanisms.
Carlson et al. (2006) and Carlson (2004) suggest that dayside reconnection is the dominant mechanism responsible for the patch production in the European sector. Whether the dayside reconnection can also account for a majority of the patches observed in the American sector needs further study, since the northern magnetic pole is located within the Canadian sector and the inclination/declination angles of magnetic field lines in the European and North American sectors are very different. In addition, high‐resolution coupled ionosphere‐thermosphere models will be needed to quantitatively evaluate the different formation mechanisms of the polar cap patches.
On the nightside, patches exit the polar cap and become a boundary blob. A statistical study using 8 years of data from the meridian scanning photometer data from Ny‐Aalesund reveals that the patches exiting the nightside polar cap mainly and nearly symmetrically around the magnetic midnight (Moen et al., 2007). A subsequent study further identified that a clear preference for earlier premidnight/later postmidnight MLTs under positive/negative IMF B y(Moen et al., 2015).
4.5 ION UPFLOW ASSOCIATED WITH POLAR CAP HIGH‐DENSITY STRUCTURES
The F‐region and topside ionospheric density is enhanced within the high‐density ionospheric structures. Convective transport of these high‐density structures into regions with enhanced precipitating particle fluxes has been suggested to be an important mechanism of generating large ion upflow fluxes (Lotko, 2007; Yau et al., 2011). Without particle precipitation, the field‐aligned plasma flows within these high‐density structures are usually downward (Ren et al., 2018; Sojka et al., 1997). When these high‐density structures convect antisunward following the convection flows to regions, such as the dayside cusp and the nightside auroral zone, intense type‐2 ion upflow fluxes (Wahlund et al., 1992), and even divergent fluxes, can form.
Observationally, a couple of fortuitous measurements showed large ion upflow fluxes on the nightside that can be related to the polar cap patches and SED plumes (Semeter et al., 2003; Tu et al., 2007; Yuan et al., 2008; Zhang et al., 2016; Zou et al., 2017b) . Using the Sondrestrom ISR, Semeter et al. (2003) reported an observation of strong ion upflow event due to drifting polar cap patch into particle precipitation at the nightside auroral poleward boundary. Combining GPS TEC and DMSP satellite observations, Yuan et al. (2008) reported large ion vertical fluxes of ~1.2 x 10 14m ‐2s ‐1measured by DMSP satellite within the SED, when it reached the nightside polar cap boundary during the 20 November 2003 superstorm. Recently, during a strong polar cap expansion event on 1 June 2013, soft electron precipitations in the cusp region moved equatorward and crossed a preexisting SED plume, resulting in strong heating and divergent ion flows and fluxes (Zou et al., 2017b). Figure 4.7shows the 2‐D TEC map at 0100 UT on 1 June 2013 with an evident SED plume, and the PFISR field‐aligned beam observations of the plasma density, temperature, flow, and flux within the plume. The peak upflow fluxes reached ~2 x 10 14m ‐2s ‐1at ~600 km in this event. Using the radio plasma imager (RPI) on the IMAGE satellite, Tu et al. (2007) found that the plasma density at ~7 R Ecan increase and decrease subsequently, when the SED plume extends to the polar cap and then disappears, and thus suggested that the high‐altitude density increase is due to the enhanced cleft ion fountain effect.
Читать дальшеИнтервал:
Закладка:
Похожие книги на «Space Physics and Aeronomy, Ionosphere Dynamics and Applications»
Представляем Вашему вниманию похожие книги на «Space Physics and Aeronomy, Ionosphere Dynamics and Applications» списком для выбора. Мы отобрали схожую по названию и смыслу литературу в надежде предоставить читателям больше вариантов отыскать новые, интересные, ещё непрочитанные произведения.


Обсуждение, отзывы о книге «Space Physics and Aeronomy, Ionosphere Dynamics and Applications» и просто собственные мнения читателей. Оставьте ваши комментарии, напишите, что Вы думаете о произведении, его смысле или главных героях. Укажите что конкретно понравилось, а что нет, и почему Вы так считаете.