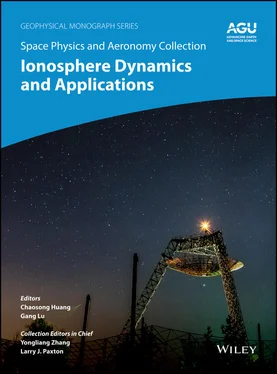
Space Physics and Aeronomy, Ionosphere Dynamics and Applications
Здесь есть возможность читать онлайн «Space Physics and Aeronomy, Ionosphere Dynamics and Applications» — ознакомительный отрывок электронной книги совершенно бесплатно, а после прочтения отрывка купить полную версию. В некоторых случаях можно слушать аудио, скачать через торрент в формате fb2 и присутствует краткое содержание. Жанр: unrecognised, на английском языке. Описание произведения, (предисловие) а так же отзывы посетителей доступны на портале библиотеки ЛибКат.
- Название:Space Physics and Aeronomy, Ionosphere Dynamics and Applications
- Автор:
- Жанр:
- Год:неизвестен
- ISBN:нет данных
- Рейтинг книги:4 / 5. Голосов: 1
-
Избранное:Добавить в избранное
- Отзывы:
-
Ваша оценка:
- 80
- 1
- 2
- 3
- 4
- 5
Space Physics and Aeronomy, Ionosphere Dynamics and Applications: краткое содержание, описание и аннотация
Предлагаем к чтению аннотацию, описание, краткое содержание или предисловие (зависит от того, что написал сам автор книги «Space Physics and Aeronomy, Ionosphere Dynamics and Applications»). Если вы не нашли необходимую информацию о книге — напишите в комментариях, мы постараемся отыскать её.
Ionosphere Dynamics and Applications Volume highlights include:9;
Behavior of the ionosphere in different regions from the poles to the equator Distinct characteristics of the high-, mid-, and low-latitude ionosphere Observational results from ground- and space-based instruments Ionospheric impacts on radio signals and satellite operations How earthquakes and tsunamis on Earth cause disturbances in the ionosphere The American Geophysical Union promotes discovery in Earth and space science for the benefit of humanity. Its publications disseminate scientific knowledge and provide resources for researchers, students, and professionals.
Space Physics and Aeronomy, Ionosphere Dynamics and Applications — читать онлайн ознакомительный отрывок
Ниже представлен текст книги, разбитый по страницам. Система сохранения места последней прочитанной страницы, позволяет с удобством читать онлайн бесплатно книгу «Space Physics and Aeronomy, Ionosphere Dynamics and Applications», без необходимости каждый раз заново искать на чём Вы остановились. Поставьте закладку, и сможете в любой момент перейти на страницу, на которой закончили чтение.
Интервал:
Закладка:
2 Chapter 2 Figure 2.1 Average convection patterns for different IMF orientations from n... Figure 2.2 (a) A schematic of the magnetosphere showing closed (red) and ope... Figure 2.3 (a) The relationship between ionospheric flow, electric field, an... Figure 2.4 Schematic of (a) gyrating particles, (b) E× Bdrifting particles... Figure 2.5 Plasma flow in the equatorial plane of the magnetosphere. (a) The... Figure 2.6 (a) A 3‐D representation of the Earth's magnetic field (southern ... Figure 2.7 (a) A cut through the magnetosphere in the X = 0 plane, showing t... Figure 2.8 (Left) Field‐aligned current pattern associated with vorticity in... Figure 2.9 (a) Deformation of the magnetopause and resulting plasma flows fo... Figure 2.10 The ionospheric convection excited in response to combined daysi... Figure 2.11 Schematic of the formation of the substorm auroral bulge. (a) A ... Figure 2.12 Three examples of observations of the expanding/contracting pola... Figure 2.13 (Left) The topology of field lines that can undergo reconnection... Figure 2.14 Contrasting the convection patterns for southwards IMF, and for ...
3 Chapter 3 Figure 3.1 Illustration of multiscale processes: (a) Large‐scale statistical... Figure 3.2 Schematic illustration of various types of high‐latitude mesoscal... Figure 3.3 Energy flux distribution and its temporal variation during the 7 ... Figure 3.4 (a) Energy flux; (b) SuperDARN fitted convection map; (c) vertica... Figure 3.5 Representative statistical distributions of mesoscale/small‐scale...
4 Chapter 4 Figure 4.1 Example of dynamic polar cap density structures (from Zou et al.,... Figure 4.2 Polar cap patches detected by two different algorithms based on i... Figure 4.3 Seasonal and UT variations of the TOI or Patch to background rati... Figure 4.4 Volumetric image of a patch using RISR‐N data on 11 December 2009... Figure 4.5 Polar cap patch median profiles compared with sector median and a... Figure 4.6 (a) TEC map of the Northern Hemisphere using ground‐based receive... Figure 4.7 (a) TEC map at 0100 UT on 1 June 2013 shows the extension of SED ... Figure 4.8 Chart of the time, in s, taken to go down to 60% of the initial l...
5 Chapter 5 Figure 5.1 The ionospheric ion upflow and outflow. Figure 5.2 Pathways of ionospheric outflow on the dynamics of the SW‐M‐I sys... Figure 5.3 The velocity‐dependent landing of O +ion outflow. Figure 5.4 Solar wind and interplanetary magnetic field for the 31 August 20... Figure 5.5 The 31 August 2005 storm characteristics: (a) simulated O +outflo... Figure 5.6 (Left panels) Outflow fluxes for (top) case A and (bottom) case B at 6 RE... Figure 5.7 Logarithm density of the total fluid, normalized to proton mass f... Figure 5.8 (a) Dst and pseudo Dst for baseline, case A and case B. Total pla... Figure 5.9 Morphology of average ion outflow from simulation C after the sim... Figure 5.10 Sequence showing the sawtooth mechanism for one oscillation from... Figure 5.11 Simulated magnetic inclination angle θ = sin −1( B z/ B ) ... Figure 5.12 Superposed epoch analysis of magnetic inclination angle near geo... Figure 5.13 Solar‐wind parameters for the 18 April 2002 storm used as upstre... Figure 5.14 Magnetic flux for observed (black) taken from Huang and Cai (200... Figure 5.15 Comparison of magnetic field taken at GOES 8 and 10 (black) with... Figure 5.16 The mass loading process on the dayside magnetopause through ion... Figure 5.17 (a) The local dayside reconnection rate and (b) the integrated d... Figure 5.18 Magnetic pressure in the equatorial plane calculated from (a) ba... Figure 5.19 Magnetic field lines in (a) the baseline simulation and (b) the ...
6 Chapter 6Figure 6.1 Azimuth scan observations with the Millstone Hill radar provide a...Figure 6.2 Aggregation of 5 minutes of Northern Hemisphere GPS TEC observati...
7 Chapter 7Figure 7.1 Overview of all Cluster density measurements based on spacecraft ...Figure 7.2 Characteristic distributions of the data set. Panel (a): Density ...Figure 7.3 Definition of reference volumes in northern and southern lobes us...Figure 7.4 Distributions similar to Figure 7.2a, but now only containing mea...Figure 7.5 Possible explanations for north‐south differences. (a) Difference...
8 Chapter 8Figure 8.1 A scenario of subauroral ionospheric heating due to wave‐particle...Figure 8.2 (Top row) Frequency‐time spectrograms for the electric fields in ...Figure 8.3 (a)–(c) The r.m.s. amplitude of wave electric fields δE lh(s...Figure 8.4 Cluster, Polar, and RBSP‐B 1‐500 eV (top) H +and (bottom) electro...Figure 8.5 SAPSWS detecteds by RBSP‐A on 17 March 2015. The same format as F...Figure 8.6 The rms amplitude of wave electric fields ( δE lh(solid black...Figure 8.7 Ionospheric structures during the SAID events on (a) 8 April 2004...Figure 8.8 Ionospheric structures during the 17 March 2015 SAPSWS events. Th...Figure 8.9 Storm-time strong SAPSWS observed by DMSP F14 and F15 on 6 April...Figure 8.10 Variation of the relative plasma density with (a) ε i−n...Figure 8.11 (a) The spectral power of plasma irregularities during the scint...Figure 8.12 The rate coefficient for the reaction (1) with N 2: Pluses “+” sh...Figure 8.13 (a) Rate coefficient for the vibrational excitation ( V = 0 → V >...Figure 8.14 (a) The low‐frequency electric field amplitude (the red line) an...
9 Chapter 9Figure 9.1 Local time and seasonal dependence of F‐region quiet‐time average...Figure 9.2 Local time and seasonal dependence of F‐region quiet‐time average...Figure 9.3 Upward F‐region equatorial vertical drifts due to neutral winds (...Figure 9.4 Local time, seasonal and longitude‐dependent equatorial quiet‐tim...Figure 9.5 Seasonal and longitudinal variations of evening prereversal veloc...Figure 9.6 Longitudinal dependence of equatorial evening prereversal velocit...Figure 9.7 Seasonal and longitudinal dependence of equatorial quiet‐time ave...Figure 9.8 Height variation of quiet‐time evening vertical drifts over Jicam...Figure 9.9 (a) Altitudinal profiles of Jicamarca late afternoon and early ni...Figure 9.10 Height profiles of evening vertical plasma drifts over Jicamarca...Figure 9.11 SYM‐H and ASY indices equatorial magnetic measurements over the ...Figure 9.12 Seasonal dependence of longitudinally averaged equatorial prompt...Figure 9.13 Seasonal depedence of longitudinally averaged equatorial disturb...Figure 9.14 Equatorial equinoctial disturbance‐dynamo vertical drifts (posit...Figure 9.15 Time series of ionosphere responses to the X17 flare that occurr...
10 Chapter 10Figure 10.1 Geometry used for the generalized Rayleigh‐Taylor instability an...Figure 10.2 Schematic of bubble formation on the bottom side of the F layer ...Figure 10.3 Numerical simulation of bubble penetration into the topside iono...Figure 10.4 Numerical simulation of bubble evolution including a conducting Figure 10.5 Three‐dimensional electron density isosurfaces and two‐dimension...Figure 10.6 ESF bubble development using (a) the donor‐cell method and (b) t...Figure 10.7 High-resolution ESF bubble development using the HIRB model...Figure 10.8 ESF bubble development. The top panel (a) is for no neutral wind...Figure 10.9 Sun‐fixed longitudinal grid showing the coarse and high resoluti...Figure 10.10 Electron density contours as a function of magnetic local time ...Figure 10.11 Plots of the electron density, vertical E x B velocity, and zon...Figure 10.12 Color‐coded contours of the electron density as a function of l...
11 Chapter 11Figure 11.1 Climatology of upward plasma drift over Jicamarca, which is plot...Figure 11.2 Percentage ESF occurrence probability as a function of PRE peak ...Figure 11.3 The monthly mean sunspot numbers from 1950 to 2020 are plotted t...Figure 11.4 The scatter in the h’F values that immediately preceded th...Figure 11.5 Three ALTAIR scans made on 19 July 1979, which show (a) a horizo...Figure 11.6 (a) The original definition of ESF referred to as the range type...Figure 11.7 Percentage occurrence frequency for RSF and FSF as a function of...Figure 11.8 (a) Occurrence frequency of radio scintillations at 40, 140 and ...Figure 11.9 Histograms showing the percentage occurrence frequency for the j...Figure 11.10 Wavelength dependences of irregularity growth rate: curve A is ...Figure 11.11 Normalized growth rate of the collisional‐shear instability, pl...Figure 11.12 A sketch showing the N‐I coupling process associated with an id...Figure 11.13 Distributions of ESF (ROCSAT‐1 data) and OLR data as a function...Figure 11.14 A comparison of deep convective activity (blue bars) with ESF o...Figure 11.15 A composite plot of h’F versus UT, on 27 March 2006, meas...Figure 11.16 A sketch that is consistent with the data from 27 March 2006 in...Figure 11.17 (a) Sketch showing the variations in h’F vs UT over BCL a...Figure 11.18 Composite plot of PRE curves from C/NOFSFigure 11.19 Seven hodographs of U , measured over Kwajalein for 1978, 1979, ...Figure 11.20 Altitude profiles of the zonal U , calculated from the HWM07 mod...Figure 11.21 Two sets of U profiles, obtained by rockets launched from Kwaja...Figure 11.22 (a) Hodograph for U , measured over Kwajalein on 17 August 1978....Figure 11.23 Sketch showing how the meridional U stabilizes or destabilizes ...Figure 11.24 DMSP climatologies for (a) 2000 and (b) 2006 are reproduced fro...Figure 11.25 Occurrence rate over Eastern Pacific sector (240°E to 285°E), e...Figure 11.26 Percentage occurrence probability, derived from AE‐E data, is p...Figure 11.27 (a) DMSP EPB climatology for 1999–2002 (redrawn from Gentile et...Figure 11.28 Climatology of EPBs derived from the dawn sector (0000–0600 LT)...Figure 11.29 Early paradigm for the development of ESF over a station in the...Figure 11.30 An ATI plot of radar backscatter as a function of altitude and ...Figure 11.31 Four stages of the upwelling paradigm, which describe EPB devel...Figure 11.32 Spatial maps of isodensity contours as a function of altitude a...Figure 11.33 Curves of h’F versus UT are shown for 22 July 1979 (black...Figure 11.34 Relationship of Δ E oscillations observed during a San Marco D p...Figure 11.35 ALTAIR maps, taken on 24 July 1979, showing (a) a large‐amplitu...Figure 11.36 A composite plot of ALTAIR scans from 24 July 1979, which shows...Figure 11.37 A composite comparison of an ATI plot of radar backscatter obta...Figure 11.38 (a) Ionogram taken at Kwajalein on 24 July 1979, at 0711 UT (18...Figure 11.39 An ionogram with DOA capability is presented, which shows multi...Figure 11.40 Summary of the EQUIS II rocket experiment on 7 August 2004. Fig...Figure 11.41 Velocity shear measurements obtained with the Jicamarca radar o...Figure 11.42 Stack of three ALTAIR scans, from 7 August 2004, which show the...Figure 11.43 Superposition of vertical‐velocity curves versus LT, measured d...Figure 11.44 A composite, which includes four ALTAIR scans taken at differen...Figure 11.45 ALTAIR scan of a backscatter plume (bottom panel) and ion densi...Figure 11.46 Example of LSWS with no structure during the first pass (orbit ...Figure 11.47 Example of RSF patches passing over Jicamarca, obtained with a ...Figure 11.48 Examples of long‐lived striations, which were launched around s...Figure 11.49 Example of AzTI plot (lower panel) of measurements made with a ...Figure 11.50 Keogram of ROTI from a network of GPS receivers in Southeast As...Figure 11.51 A train of 14 EPBs observed with C/NOFS during three consecutiv...Figure 11.52 The ion density (left column) and vertical velocity (right colu...Figure 11.53 Sketch for Model 2 interpretation, reproduced from Huang et al....Figure 11.54 Spatial maps of coherent backscatter during presence of westwar...Figure 11.55 Example of vortical plasma flow and development of EPBs, 31 Jul...Figure 11.56 A composite plot, which includes the h’F plots from MAN a...Figure 11.57 A sketch that shows a seed Δ E in region of westward drift; if i...Figure 11.58 Example of EPBs obtained with the C/NOFS satellite on 5 June 20...Figure 11.59 The occurrence frequency of ESF over Baguio, from Marasigan (19...Figure 11.60 (a) Histogram for FSF occurrences; (b) variation in h’F f...Figure 11.61 Frequency of days of radar echoes during low solar and magnetic...Figure 11.62 An example of an upwelling plume, observed with the EAR on 20 J...Figure 11.63 Backscatter plumes observed with the CXI radar on 23 July 2011 ...Figure 11.64 Backscatter plumes observed with the CXI radar on 3 July 2011 w...Figure 11.65 A sketch of the evening equatorial vortex, where red (blue) lin...Figure 11.66 OLR maps showing the temporal development of a MCC (blue colore...
Читать дальшеИнтервал:
Закладка:
Похожие книги на «Space Physics and Aeronomy, Ionosphere Dynamics and Applications»
Представляем Вашему вниманию похожие книги на «Space Physics and Aeronomy, Ionosphere Dynamics and Applications» списком для выбора. Мы отобрали схожую по названию и смыслу литературу в надежде предоставить читателям больше вариантов отыскать новые, интересные, ещё непрочитанные произведения.
Обсуждение, отзывы о книге «Space Physics and Aeronomy, Ionosphere Dynamics and Applications» и просто собственные мнения читателей. Оставьте ваши комментарии, напишите, что Вы думаете о произведении, его смысле или главных героях. Укажите что конкретно понравилось, а что нет, и почему Вы так считаете.
