According to Callegaro (2013), in web surveys, it is possible to distinguish between device‐type paradata and questionnaire navigation paradata. Device‐type paradata provide information regarding the kind of device used to complete the interview (i.e., tablet or desktop). They provide information about the technical features of the device (browser, screen resolution, IP address, and several other characteristics). Questionnaire navigation paradata describe the full set of activities undertaken in completing the questionnaire, for example, mouse clicks, forward and backward movements along the questionnaire, number of error messages generated, time spent per question, and question answered before dropping out (if dropout exists). Other authors (for example, Heerwegh, 2011) distinguish between client‐side paradata (they include click mouse and everything related to the activities of the respondent) and server‐side paradata (they include everything collected from the server hosting the survey). The literature proposes also other classifications, and the technology evolution is going to offer new types of paradata. Capturing paradata is one of the main challenges. Software industry improves greatly and constantly. Traditionally most programs were collecting only a few server‐side paradata. Not every program is registering client‐side paradata. Technological innovation and commitment on this important task have contributed to enlarge the offer of programs collecting paradata and transmitting the often unintelligible strings into useful data sets. Due to high innovation in this field, software is fast over; some discussion about the topic is found in Olson and Parkhurst (2013) and in Kreuter (2013).
Currently, it is clear that paradata are useful data types for several different functions, such as monitoring nonresponse and measurement profiles, checking for measurement error and bias, improving questionnaire usability, and fixing many other problems. Due to their potential usefulness in helping to understand relationships between different errors, improving the data collection process, and the quality of results, paradata require a decisional sub‐step to plan their structure and data collection.
Regarding the Design questionnaire sub‐step, several decisions must be undertaken. First, decision about the Questions’ wording and the Response format takes places. Question wording rules are similar to the other modes, except that the sentences should be especially simple and short; this recommendation is stronger for web surveys than for the other modes. As regards Response format , even if most of the basic criteria are like traditional modes, the general rules and response formats in web surveys are different and specific to a self‐completed questionnaire and to the digital format used (see Chapter 7). The criteria for mobile web survey are similar to the ones for web surveys. Some specific requirements are due to the technical structure of the devices, especially to the characteristic of the small size of the screen, especially in smartphones. A poorly structured questionnaire and technically not adequate to mobile phones could critically affect the quality of the survey; errors could arise in terms of response rate, item nonresponse, and estimates. An important issue arises when a mixed‐mode approach is adopted. In this case, the decision if the optimal approach for each mode or a unimode approach has to be adopted is debated (see Dillman, Smyth, and Christian 2014). Recently it has been suggested to achieve the balance between the basic presumption that survey questions should be as identical as possible between modes (unimode approach) and, at the same time, consider that mode effects might be reduced by optimizing each questionnaire for corresponding mode (mode‐specific approach).
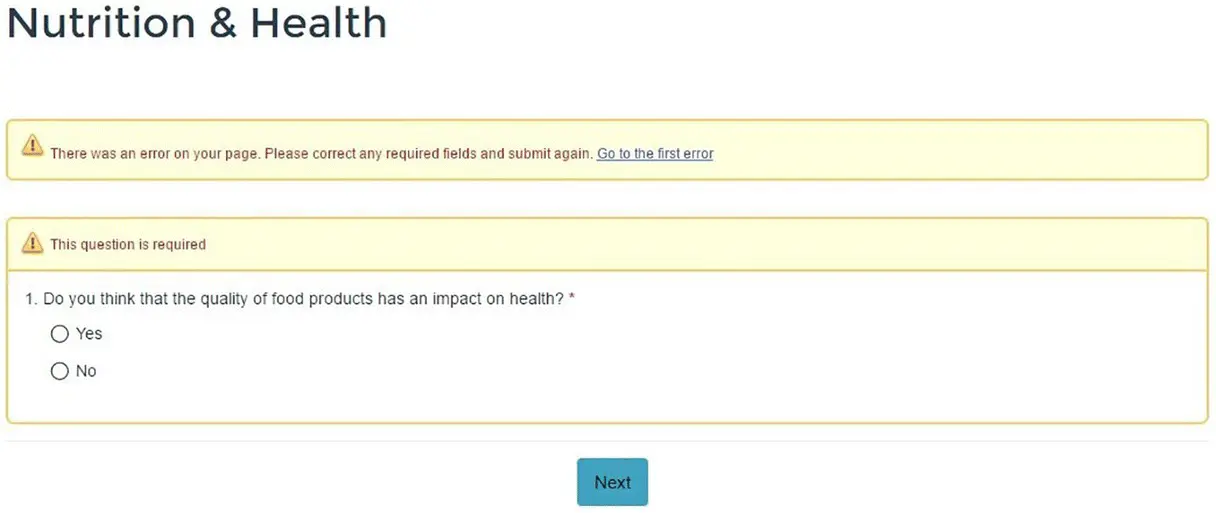
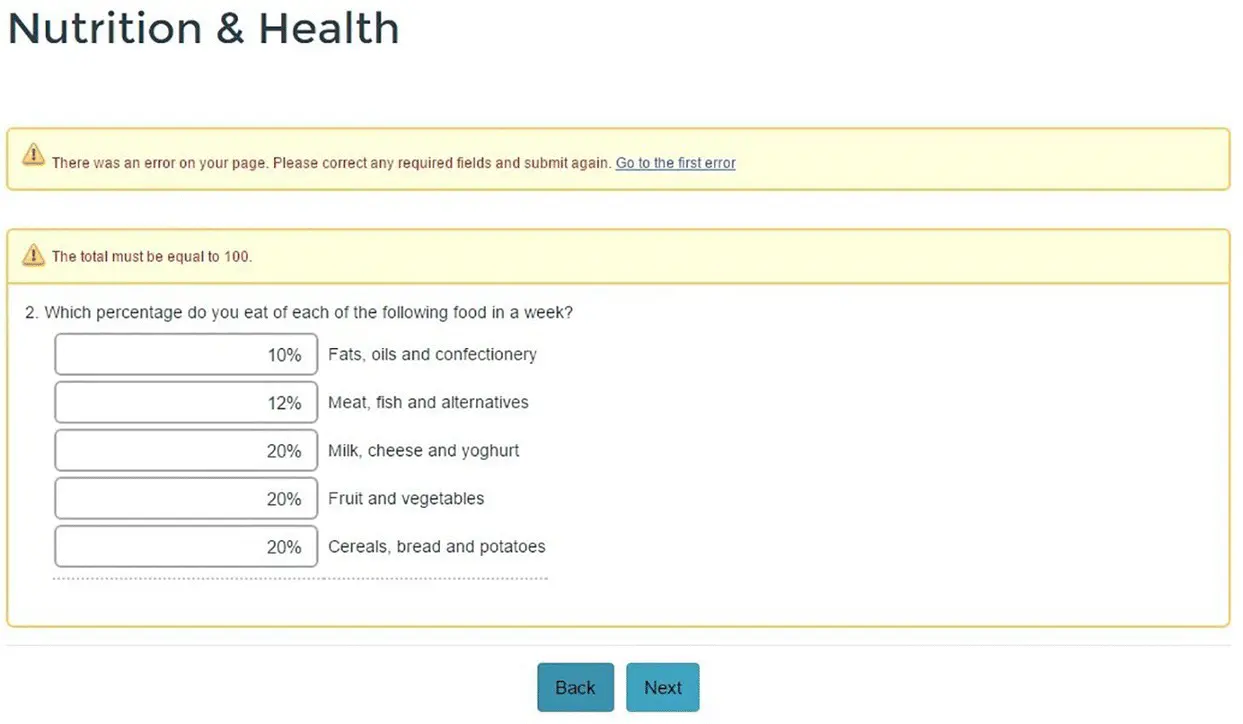
Another important sub‐step related to the questionnaire is Interactivity . A web process provides the opportunity for automatically interacting with the respondent. For example, pop‐up windows with a needed definition or other forms of metadata could appear. Some questions (one or more questions) are compulsory by design, meaning the blocking of the questionnaire's progress, until the questions are fulfilled ( Example 3.2, Figure 3.3). Furthermore, the researcher could allow for going up and down throughout the questions or just a question‐by‐question (top‐down) approach. In this case, when going from one page of the questionnaire to the successive page, an error message is given, and the uncompleted question appears again. In some cases, activation of the automatic check is necessary, for example, if the question asks for a percentage composition, the answer check is during the compilation and an error message appears ( Example 3.3, Figure 3.4). The error correction takes place before continuing the questionnaire compilation.
EXAMPLE 3.2Compulsory question
In this case, the respondent is not allowed for skipping the answer to question 1.
An error message appears and the question is submitted again.

Figure 3.3 Error message for a compulsory question in the Nutrition & Health Survey
Interactivity provides advantages in the quality of the web or mobile web surveys by reducing imputation errors and item nonresponses (see Example 3.4). The desired degree of interactivity is guiding the questionnaire implementation, since more sophisticated interactivity actions are supported only from some specific programs.
EXAMPLE 3.3Automatic control in web questionnaire
The question is asking for a percentage composition. Automatically is checked if the sum is equal to 100%.

Figure 3.4 Question asking for percentage: error message
EXAMPLE 3.4Paper versus web: errors comparison
In the transition phase from paper to web for the business survey (structural business statistics [SBS] survey) conducted in Italy, errors in the paper and web questionnaire are compared. From Table 3.1, it is evident there is a general improvement in various types of errors: less need for checking (checks pending) in web data, a smaller average number of errors corrected, and fewer replacements.
Table 3.1 Types of detected errors by response mode (averages on total responses: SBS survey)
|
Checks pending |
Corrected errors |
Replacements |
| Paper |
0.89 |
4.74 |
4.89 |
| Web |
0.85 |
2.88 |
3.39 |
The third important sub‐step in questionnaire design is Visualization . This is a critical point in a web/mobile web survey. Colors, pictures, character formats, and the presence or absence of a progress bar are all factors affecting the interviewee's perception and could greatly improve or reduce response errors (response values elated to the interpretation of the content and of the questions, item nonresponses, decision to participate in the survey, etc.). Colors, for instance, affect the readability of the screen, possibly making completion less pleasant. Dark and highly contrasted colors are more difficult to read, as well as too hell colors. Formats and pictures have a different impact if presented on a PC screen rather than on a smartphone screen. On a small screen pictures are disturbing. Thus, the visual readability of the questionnaire is essential to enhance participation, not increase measurement errors (due to bad understanding of the questions or distraction due to not adequate—in the content and in the size—pictures).
Читать дальше


