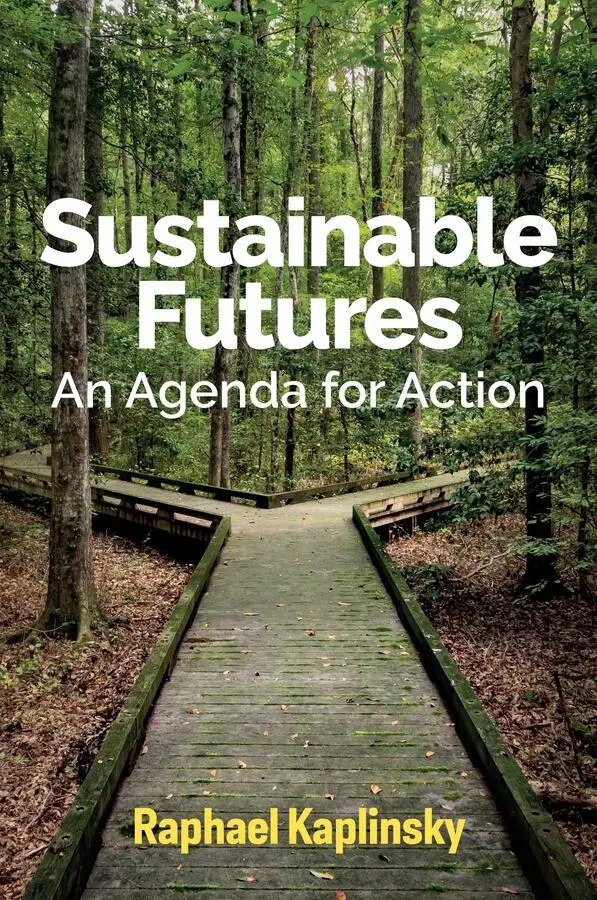
Raphael Kaplinsky - Sustainable Futures
Здесь есть возможность читать онлайн «Raphael Kaplinsky - Sustainable Futures» — ознакомительный отрывок электронной книги совершенно бесплатно, а после прочтения отрывка купить полную версию. В некоторых случаях можно слушать аудио, скачать через торрент в формате fb2 и присутствует краткое содержание. Жанр: unrecognised, на английском языке. Описание произведения, (предисловие) а так же отзывы посетителей доступны на портале библиотеки ЛибКат.
- Название:Sustainable Futures
- Автор:
- Жанр:
- Год:неизвестен
- ISBN:нет данных
- Рейтинг книги:5 / 5. Голосов: 1
-
Избранное:Добавить в избранное
- Отзывы:
-
Ваша оценка:
Sustainable Futures: краткое содержание, описание и аннотация
Предлагаем к чтению аннотацию, описание, краткое содержание или предисловие (зависит от того, что написал сам автор книги «Sustainable Futures»). Если вы не нашли необходимую информацию о книге — напишите в комментариях, мы постараемся отыскать её.
While this conclusion can lead to despair, in this broad-ranging book Raphael Kaplinsky, a leading development policy analyst, argues that the future is not necessarily bleak. Interrogating the causes and nature of the systemic crises we are living through, he shows how the challenges which we now face mirror previous historical epochs, in which dominant ‘techno-economic’ paradigms flourish, mature and run into crisis. In each case, decisive action is required to move to a more economically and socially sustainable world. In our time, we are witnessing the exhaustion of the Mass Production paradigm. How we herald and manage the transition to the next paradigm – that of Information and Communications Technologies – will determine our capacity to build a more prosperous, equitable and environmentally sustainable world. This book sets out an integrated agenda for action by multiple stakeholders to achieve this end.
Sustainable Futures — читать онлайн ознакомительный отрывок
Ниже представлен текст книги, разбитый по страницам. Система сохранения места последней прочитанной страницы, позволяет с удобством читать онлайн бесплатно книгу «Sustainable Futures», без необходимости каждый раз заново искать на чём Вы остановились. Поставьте закладку, и сможете в любой момент перейти на страницу, на которой закончили чтение.
Интервал:
Закладка:
2 Chapter 3 Figure 3.1Top 1% personal wealth share in emerging and rich countries, 1913–2015 Figure 3.2Changes in global inequality, 1980–2016 Figure 3.3Share of labour in total national income, high-income economies, 1960–201... Figure 3.4aLife-expectancy and inequality, 22 OECD economies Figure 3.4bLife-expectancy and inequality, 50 US states Figure 3.5Health and social problems and degree of inequality, inter-country differences Figure 3.6Index of status inequality and degree of inequality Figure 3.7Index of social participation and degree of inequality Figure 3.8Index of civic participation and degree of inequality Figure 3.9Belief in conspiracy theories, US and UK Figure 3.10Inflows of migrants, selected high-income economies, 2006–2016 (millions) Figure 3.11Immigrant share of population and far-right voting %
3 Chapter 4 Figure 4.1The Holocene in historical perspective: not just warm temperatures but stable te... Figure 4.2The Great Acceleration Figure 4.3Take, Make, Use and Waste Figure 4.4Energy equivalent global output of different energy forms, 1800–2019 (ter... Figure 4.5The growth in global total resource supply, 1970–2010 (million tonnes) Figure 4.6Index of energy efficiency in the EU, 1990–2014 (1990 = 100) Figure 4.7Variation of CO 2emissions from transport in the EU, 1990 and 2010 (m... Figure 4.8US advertising expenditure, 1900–2007 ($m) Figure 4.9Rising frequency of natural disasters, 1980–2017
4 Chapter 5 Figure 5.1Six phases of techno-economic paradigms Figure 5.2US corporate profitability as share of domestic income, 1951–1966 and 196... Figure 5.3US corporate profitability as share of domestic income, 1990–2007 (post-t...
5 Chapter 6 Figure 6.1Six phases of techno-economic paradigms
6 Chapter 7 Figure 7.1Broadband connections per 100 inhabitants, 2005–2018 Figure 7.2The global share of different energy sources, 1971–2014 Figure 7.3Frequency and cost escalation of electricity infrastructure projects (based on a... Figure 7.4The Zambezi river basin Figure 7.5Global average annual net capacity additions by energy source Figure 7.6Wheat and barley crop yields in UK agriculture, 1948–2017 (tonnes/hectare... Figure 7.7Sources of productivity growth in UK agriculture, 1973–2019 (1973 = 100) Figure 7.8‘Tom’ gathering data on soil and weeds
7 Chapter 8 Figure 8.1Levels of circularity: the 10 Rs Figure 8.2Total UK tax receipts, 2018–2019 (£bn)
Guide
1 Cover
2 Table of Contents
3 Begin Reading
Pages
1 i
2 ii
3 iii
4 iv
5 vii
6 viii
7 ix
8 x
9 xii
10 xiii
11 xiv
12 xv
13 xvi
14 xvii
15 xviii
16 1
17 2
18 3
19 4
20 5
21 6
22 7
23 8
24 9
25 10
26 11
27 12
28 13
29 14
30 15
31 16
32 17
33 18
34 19
35 20
36 21
37 22
38 23
39 24
40 25
41 26
42 27
43 28
44 29
45 30
46 31
47 32
48 33
49 34
50 35
51 36
52 37
53 38
54 39
55 40
56 41
57 42
58 43
59 44
60 45
61 46
62 47
63 48
64 49
65 50
66 51
67 52
68 53
69 54
70 55
71 56
72 57
73 58
74 59
75 60
76 61
77 62
78 63
79 64
80 65
81 66
82 67
83 68
84 69
85 70
86 71
87 72
88 73
89 74
90 75
91 76
92 77
93 78
94 79
95 80
96 81
97 82
98 83
99 84
100 85
101 86
102 87
103 88
104 89
105 90
106 91
107 92
108 93
109 94
110 95
111 96
112 97
113 98
114 99
115 100
116 101
117 102
118 103
119 104
120 105
121 106
122 107
123 108
124 109
125 110
126 111
127 112
128 113
129 114
130 115
131 116
132 117
133 118
134 119
135 120
136 121
137 122
138 123
139 124
140 125
141 126
142 127
143 128
144 129
145 130
146 131
147 132
148 133
149 134
150 135
151 136
152 137
153 138
154 139
155 140
156 141
157 142
158 143
159 144
160 145
161 146
162 147
163 148
164 149
165 150
166 151
167 152
168 153
169 154
170 155
171 156
172 157
173 158
174 159
175 160
176 161
177 162
178 163
179 164
180 165
181 166
182 167
183 168
184 169
185 170
186 171
187 172
188 173
189 174
190 175
191 176
192 177
193 178
194 179
195 180
196 181
197 182
198 183
199 184
200 185
201 186
202 187
203 188
204 189
205 190
206 191
207 192
208 193
209 194
210 195
211 196
212 197
213 198
214 199
215 200
216 201
217 202
218 203
219 204
220 205
221 206
222 207
223 208
224 209
225 210
226 211
227 212
228 213
229 214
230 215
231 216
232 217
233 218
234 219
235 220
236 221
237 222
238 223
239 224
240 225
241 235
242 236
243 237
244 238
245 239
Praise
‘Faced with what some describe as extinction-level threats, Kaplinsky dares to say this is no time to despair. With his considerable expertise as a developmental economist, he shows that trying to tick off each problem as it comes along is doomed to failure. Part history, part manifesto, Sustainable Futures calls for an integrated approach which brings together the resources of government and the power of the people. Those who want to avoid the mistakes of the past and re-make our future should read this book.’
George Alagiah, BBC Journalist and Author
‘Dedicated to “all the grandchildren”, Sustainable Futures is written in the hope of contributing to a pathway out of the current dreadful state of our world and into a sustainable future for them. Kaplinsky provides a theoretical and conceptual framework to better understand the current crises and to extract lessons for the future from epochal moments in history and sets out an ambitious agenda for change. He has indeed provided a compelling and hopeful message “for the grandchildren”.’
Keith Bezanson, former President of Canada’s International Development Research Centre
‘A most inspirational and enlightening book by a leading development scholar and thinker, analysing courses and actions to build an economically, socially and environmentally sustainable future. A book with historical and analytical depth as well as a global and forward vision which is much needed at a moment when the world is at crossroads.’
Читать дальшеИнтервал:
Закладка:
Похожие книги на «Sustainable Futures»
Представляем Вашему вниманию похожие книги на «Sustainable Futures» списком для выбора. Мы отобрали схожую по названию и смыслу литературу в надежде предоставить читателям больше вариантов отыскать новые, интересные, ещё непрочитанные произведения.


Обсуждение, отзывы о книге «Sustainable Futures» и просто собственные мнения читателей. Оставьте ваши комментарии, напишите, что Вы думаете о произведении, его смысле или главных героях. Укажите что конкретно понравилось, а что нет, и почему Вы так считаете.