Kristen St. John - Reconstructing Earth's Climate History
Здесь есть возможность читать онлайн «Kristen St. John - Reconstructing Earth's Climate History» — ознакомительный отрывок электронной книги совершенно бесплатно, а после прочтения отрывка купить полную версию. В некоторых случаях можно слушать аудио, скачать через торрент в формате fb2 и присутствует краткое содержание. Жанр: unrecognised, на английском языке. Описание произведения, (предисловие) а так же отзывы посетителей доступны на портале библиотеки ЛибКат.
- Название:Reconstructing Earth's Climate History
- Автор:
- Жанр:
- Год:неизвестен
- ISBN:нет данных
- Рейтинг книги:3 / 5. Голосов: 1
-
Избранное:Добавить в избранное
- Отзывы:
-
Ваша оценка:
Reconstructing Earth's Climate History: краткое содержание, описание и аннотация
Предлагаем к чтению аннотацию, описание, краткое содержание или предисловие (зависит от того, что написал сам автор книги «Reconstructing Earth's Climate History»). Если вы не нашли необходимую информацию о книге — напишите в комментариях, мы постараемся отыскать её.
how we know
what we know
Reconstructing Earth’s Climate History, Second Edition,
Reconstructing Earth's Climate History — читать онлайн ознакомительный отрывок
Ниже представлен текст книги, разбитый по страницам. Система сохранения места последней прочитанной страницы, позволяет с удобством читать онлайн бесплатно книгу «Reconstructing Earth's Climate History», без необходимости каждый раз заново искать на чём Вы остановились. Поставьте закладку, и сможете в любой момент перейти на страницу, на которой закончили чтение.
Интервал:
Закладка:
To do:
1 Find your assigned core(s) in Table 2.1and on the base map ( Figure 2.2). Examine the photo of your core (see supplemental resources) and make a list of observations and a list of questions about what you see:
| ID of your assigned core(s) (e.g. 112‐687A‐2H) | Observations about your core(s) | Questions about your core(s) |
1 Lithology refers to the visible physical characteristics of sediment or rock. Design a way to organize and record your observations of the lithology of the sediment in your core that could be used by all of the students in the class for all of the cores. This means you need to come up with categories (e.g. color, sedimentary structures) for your observations and also a means of recording them (i.e. all observations written, all observations sketched, some combination of the two?). Record your ideas below:
| Categories of Observations to Include | How to Record those Observations |
1 Use the core description form provided by your instructor OR use the space below to describe the lithologic features of one of your sediment cores based on your observations of the core photo. The core photos are available in the supplementary resources. If you are using the space below, follow a format agreed upon by your class. FIGURE 2.2. Physiographic map of the world's oceans, showing bathymetric features and the site numbers and water depths (meters) of locations used in this exercise.Map modified from: Hubbard Scientific, http://www.amep.com/standarddetail.asp?cid=1119.
2 Based on the work you have done in this exercise, explain the importance of a systematic, complete, and consistent method of recording scientific observations.
Part 2.3. Sediment Composition
Introduction
One lithologic category that typically cannot be determined from observation of the split core surface alone is sediment composition. However, this can be determined by examining a small (toothpick‐tip sized) amount of sediment under a binocular microscope and matching the observed grain types to categories of known grain types. This method is called smear slide analysis. The main grain categories that compose marine sediment are mineralsand microfossils. Some of the most common grain types are shown in Figure 2.3.
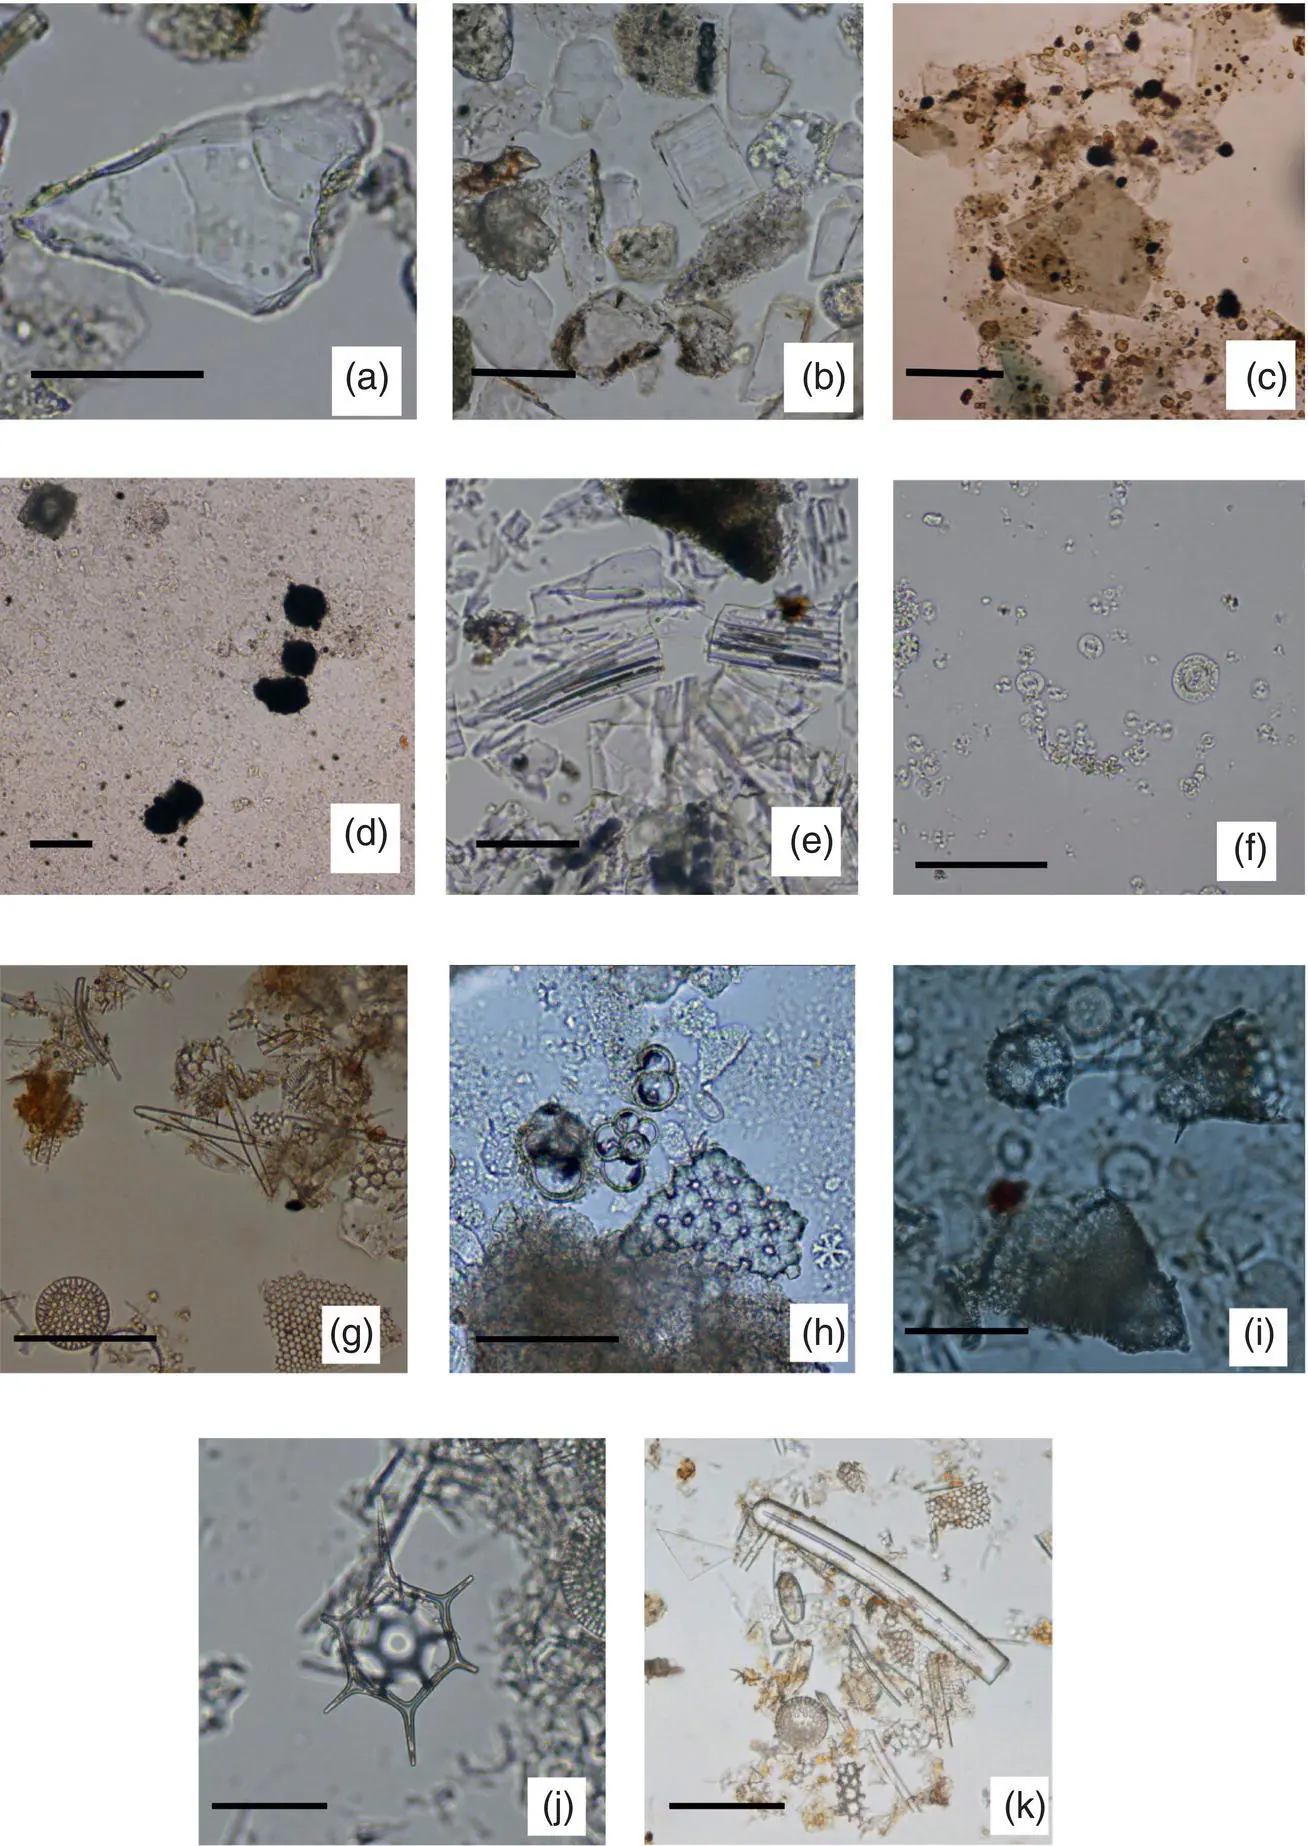
FIGURE 2.3. Photos of minerals, volcanic glass, and microfossils as seen through a petrographic microscope. Bar scale is 50 μm (0.05 mm). Images are from the IODP Digital Reference for Smear Slide Analysis of Marine Mud (Marsaglia et al., 2013, 2015; http://iodp.tamu.edu/publications/TN.html). a= sand‐size quartz grain with conchoidal fracture. b= rectangular grains are feldspar minerals; also shown are quartz grains and rock fragments. c= large flakes of mica (biotite and chlorite), along with smaller quartz and feldspar grains, and opaque rounded grains of pyrite. d= clay minerals, with much larger opaque pyrite grains and a calcite crystal (corner). e= volcanic glass (ash). f= calcareous nannofossils; g= elongate pennate diatoms and round centric diatoms, and diatom fragments; h= Three whole planktic foraminifera, and one very large porous foraminifera fragment, surrounded by calcareous nannofossils; i= radiolaria, with centric diatoms in the background; j= silicoflagellate; k= large sponge spicule surrounded by diatom fragments.
This exercise primarily focuses on composition and texture data observed in smear slides from samples taken from the cores you described in Part 2.2. These data are reported in Table 2.2. The compositiondata are estimates of the relative abundances of specific grain types (i.e. minerals, microfossils, tiny rock fragments) observed in the smear slides. The texturaldata are estimates of the relative percentages of sand‐, silt‐, and clay‐sized grains based on smear slide observation. Table 2.2also includes one type of data that is not from the smear slides – the presence of pebbles observed on the split core. Pebbles (which are large rock fragments) are too large for inclusion in smear slides, but their presence is often indicative of a particular lithology as you will learn in this exercise.
Data Analysis
1 Go to Table 2.2(smear slide data) and find the row(s) of data that correspond to smear slide samples taken from your core(s). Note that this should be the same core(s) assigned to you in Part 2.2. What are the minerals and fossils in your core(s)? List the mineral and microfossil components below, and circle the photos in Figure 2.3that show what these grains look like when viewing smear slides through a microscope.
| ID of your assigned core(s) (e.g. 112‐687A‐2H) | Minerals present | Microfossils present |
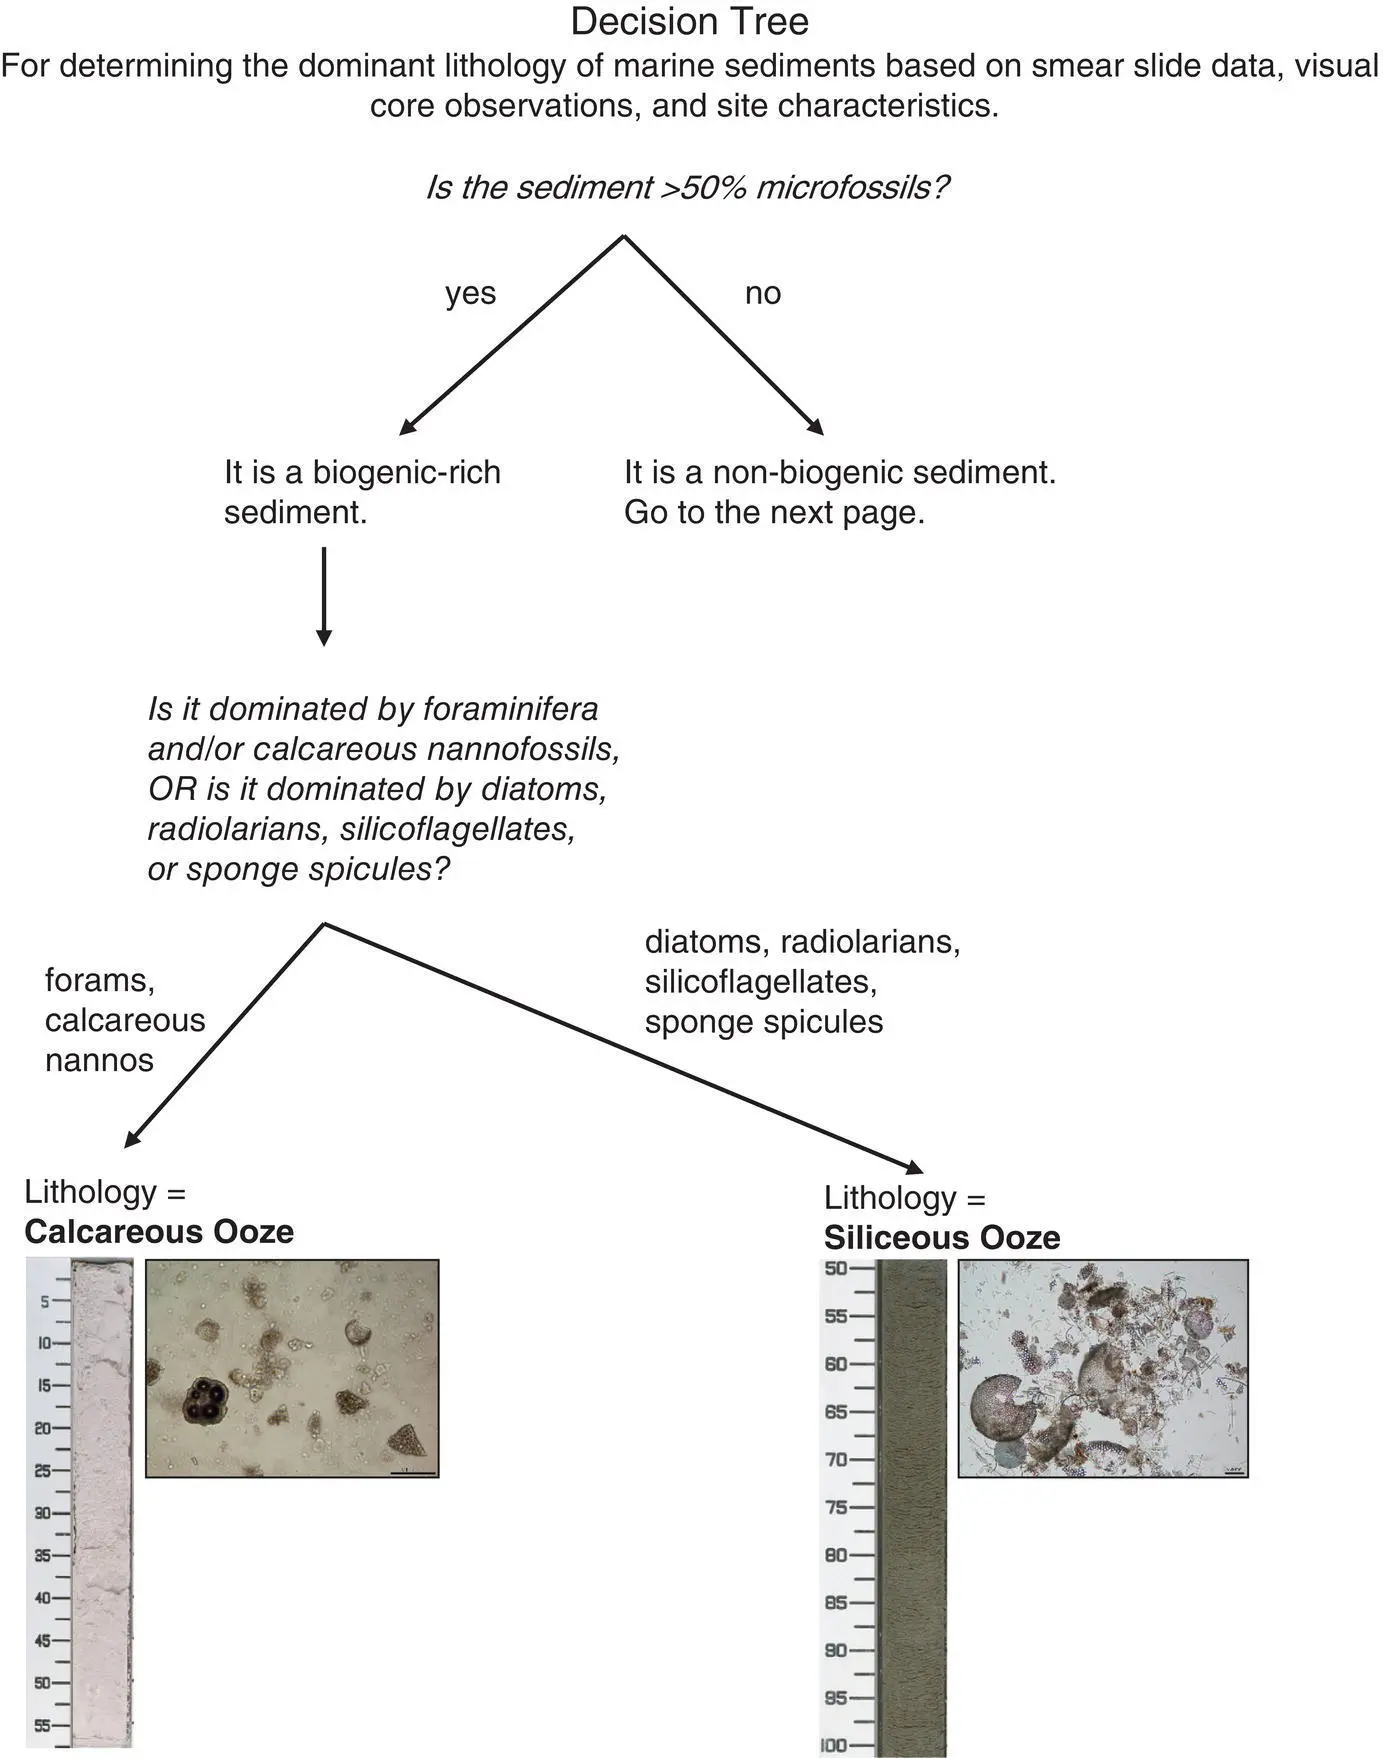
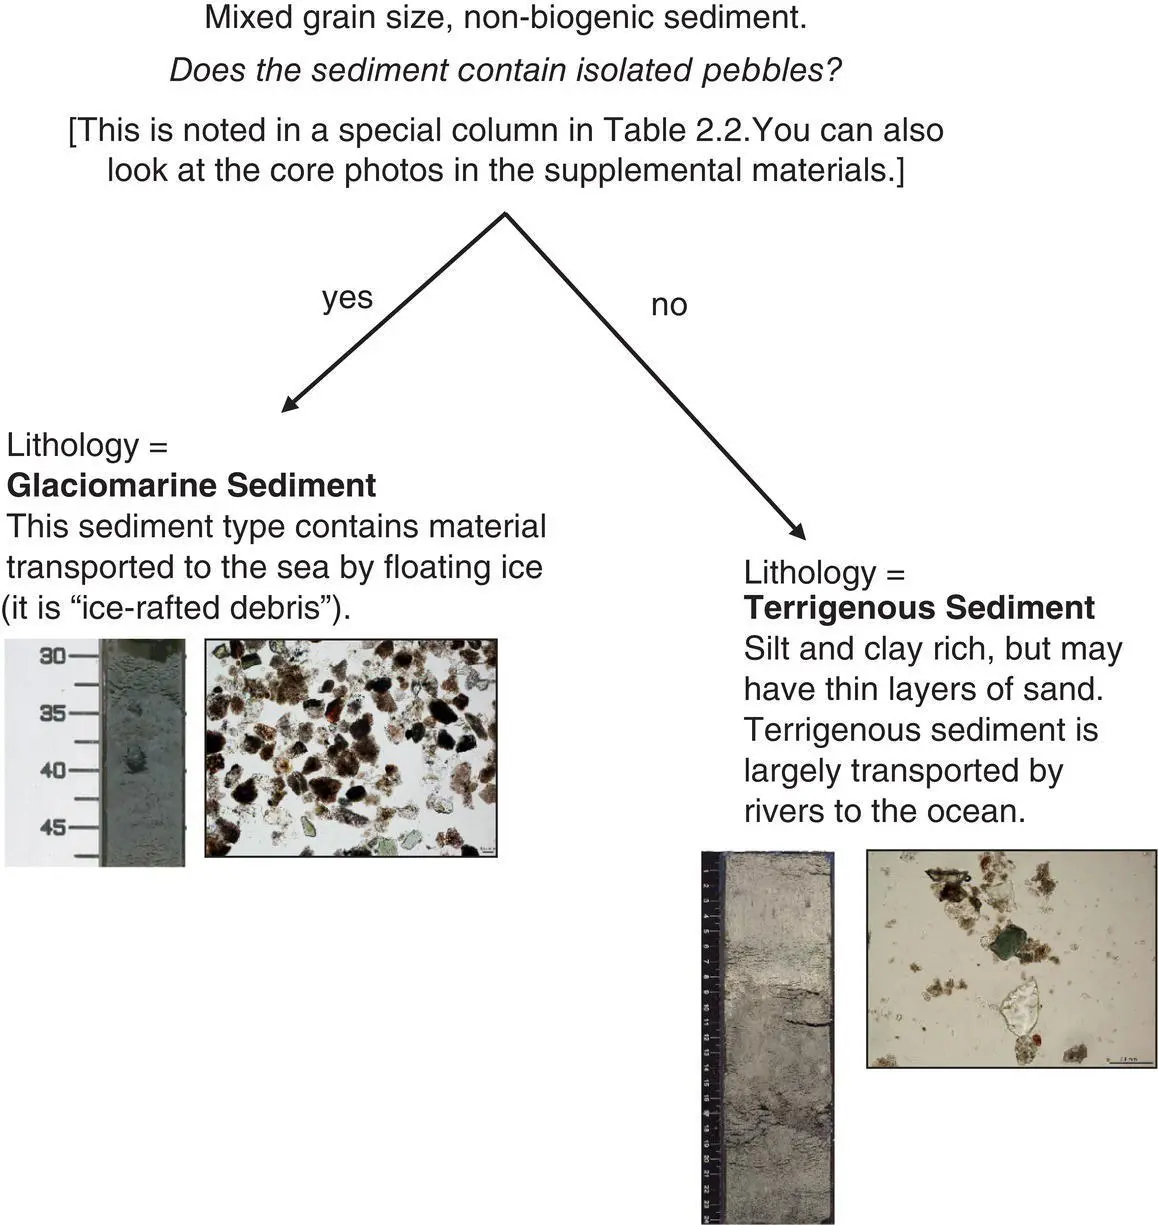
1 The composition and texture data from the smear slide data in Table 2.2will serve as the primary means for determining the lithologic name of the sediment (Mazzullo and Graham, 1988). Read the Box below that describes important information about using the Decision Tree. Then use the Decision Tree (following pages) to determine the lithologic name of the sediment in your core(s):ID of Your Assigned Core(s) __________________________Lithologic Name of the Sediment in the Core(s) __________________________
DETERMINING LITHOLOGIC NAMES WITH A DECISION TREE
The goal of the decision tree is to use composition and texture data from smear slide analysis, core photos, and knowledge of the water depth and distance from land of cored sites on the seafloor to determine the lithologic name of the sediment. The decision tree aims to capture the most distinctive (i.e. end‐member) lithologies of marine sediments. These are:
Calcareous ooze: biogenic sediments composed of calcareous nannofossils and/or foraminifera.
Siliceous ooze: biogenic sediments composed of diatoms, radiolarians, sponge spicules, and/or silicoflagellates.
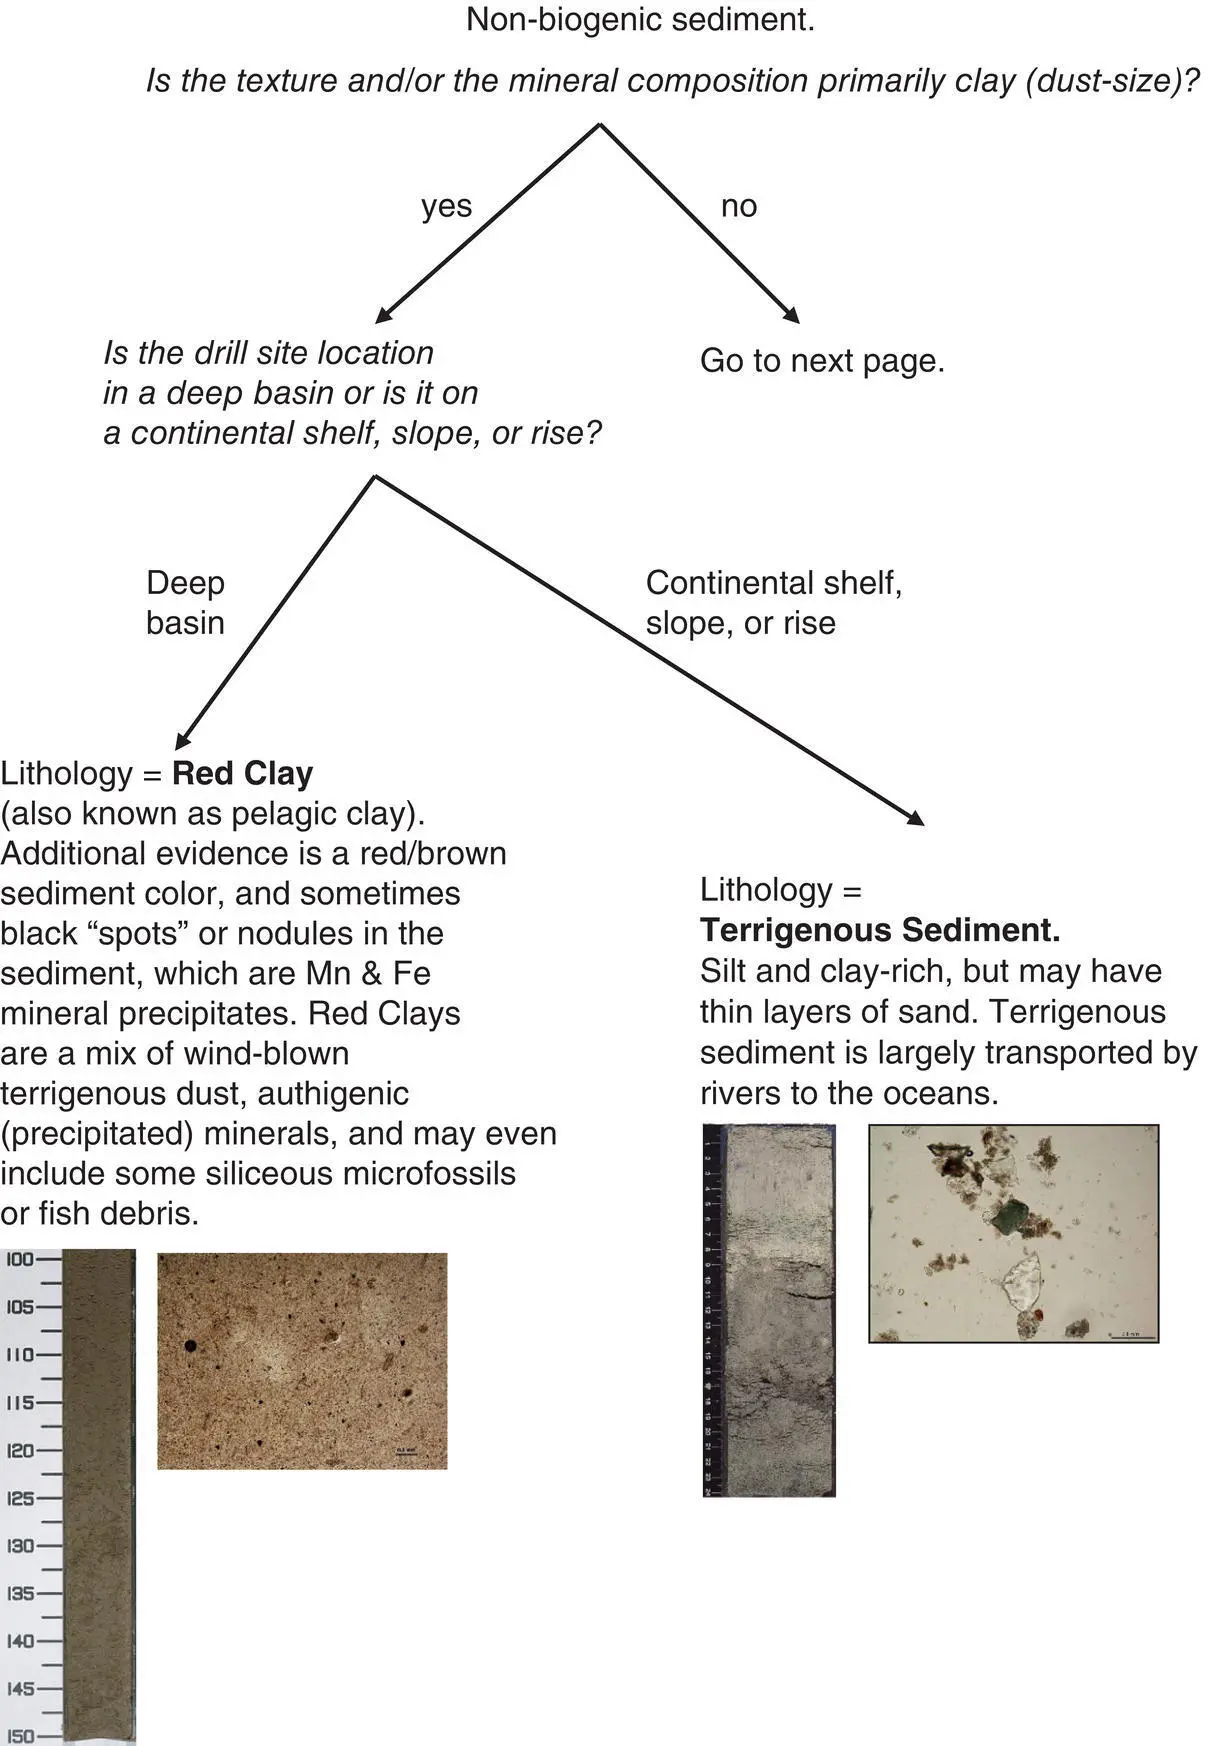
Red clays: very fine terrigenous sediment that often contains siliceous microfossils, fish teeth, Mn–Fe micronodules, and/or volcanic glass.
Terrigenous sediment: sediment from the weathering of continents or volcanic islands.
Glaciomarine sediment: sediment containing terrigenous sand, pebbles, or cobbles transported to the sea by icebergs.
Note, while the above five marine sediment lithologies are the most distinctive sediment types, mixed lithologies are common(Mazzullo and Graham, 1988). In addition, the lithologies can also change within a core. For example, the sediment could alternate between red clay and siliceous ooze, or gradually change from one to another. In any marine sediment lithology, but especially in biogenic oozes and deep‐sea red clays, layers of volcanic ashmay be distinguishable, as a minor lithology.
Интервал:
Закладка:
Похожие книги на «Reconstructing Earth's Climate History»
Представляем Вашему вниманию похожие книги на «Reconstructing Earth's Climate History» списком для выбора. Мы отобрали схожую по названию и смыслу литературу в надежде предоставить читателям больше вариантов отыскать новые, интересные, ещё непрочитанные произведения.

Обсуждение, отзывы о книге «Reconstructing Earth's Climate History» и просто собственные мнения читателей. Оставьте ваши комментарии, напишите, что Вы думаете о произведении, его смысле или главных героях. Укажите что конкретно понравилось, а что нет, и почему Вы так считаете.