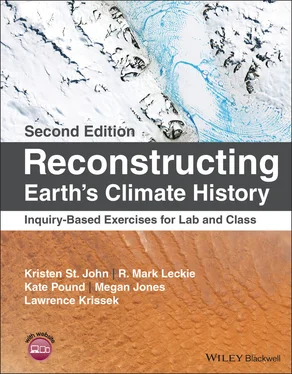
Kristen St. John - Reconstructing Earth's Climate History
Здесь есть возможность читать онлайн «Kristen St. John - Reconstructing Earth's Climate History» — ознакомительный отрывок электронной книги совершенно бесплатно, а после прочтения отрывка купить полную версию. В некоторых случаях можно слушать аудио, скачать через торрент в формате fb2 и присутствует краткое содержание. Жанр: unrecognised, на английском языке. Описание произведения, (предисловие) а так же отзывы посетителей доступны на портале библиотеки ЛибКат.
- Название:Reconstructing Earth's Climate History
- Автор:
- Жанр:
- Год:неизвестен
- ISBN:нет данных
- Рейтинг книги:3 / 5. Голосов: 1
-
Избранное:Добавить в избранное
- Отзывы:
-
Ваша оценка:
- 60
- 1
- 2
- 3
- 4
- 5
Reconstructing Earth's Climate History: краткое содержание, описание и аннотация
Предлагаем к чтению аннотацию, описание, краткое содержание или предисловие (зависит от того, что написал сам автор книги «Reconstructing Earth's Climate History»). Если вы не нашли необходимую информацию о книге — напишите в комментариях, мы постараемся отыскать её.
how we know
what we know
Reconstructing Earth’s Climate History, Second Edition,
Reconstructing Earth's Climate History — читать онлайн ознакомительный отрывок
Ниже представлен текст книги, разбитый по страницам. Система сохранения места последней прочитанной страницы, позволяет с удобством читать онлайн бесплатно книгу «Reconstructing Earth's Climate History», без необходимости каждый раз заново искать на чём Вы остановились. Поставьте закладку, и сможете в любой момент перейти на страницу, на которой закончили чтение.
Интервал:
Закладка:
Part 1.1. Archives and Proxies
1 Think about how we know about past events in human history (e.g. the expansion of the Roman Empire, or the American Revolution). What types of records document those events?
2 Now think about Earth's history, specifically the past environmental or climatic conditions at times before recorded human history. What records might there be of such conditions? Make a list of your ideas.
3 Figure 1.1shows an assemblage of five major types of natural archives of Earth's environmental and climatic history. What common feature(s) do each of these paleoclimate archives share?The photographs in Figure 1.1comprise an assemblage of five major types of natural records, or archives, of Earth's environmental and climatic history. Just like a diary or other historical document, the layers in these natural archives contain indirect evidence (i.e. proxies) about past conditions and events, recorded in sequential order. The evidence is specific to a certain time period and may be general or very detailed, depending on the rate at which that information was recorded. The faster the rate at which the recorder grew (trees and corals), accumulated (snow and ice), or was deposited (sedimentary sequences), the more detailed the record is, and the higher its resolution. For example, a record in which an annual signal can be observed has a very high resolution. In contrast, if the finest observable details are on the order of a million years, then that record would have a low resolution.The usefulness of a record is also affected by how regularly information was recorded. If information was recorded continuously the record would be more complete than if events were recorded only occasionally.
4 Consider again each of the archives in Figure 1.1. Mark an “X” on each figure to indicate the oldest part of the record. Explain your reasoning here: FIGURE 1.2. Terrestrial and marine depositional environments, and example settings (lettered red boxes) of paleoclimate archives. Letters correspond to archives in Figure 1.1. A = tree ring record in a forest, B = cave system containing speleothems, C = glacial ice, D = coral record in reef setting, E1 = sedimentary sequence in a mountainside outcrop, E2 = sedimentary sequence in a lake bed, E3 = sedimentary sequence in the ocean floor.Source: Drawn by Lynn Fichter (James Madison Univ.)
5 Figure 1.2is a sketch of terrestrial (land) and marine (ocean) depositional environments (i.e., environments where sediments are deposited). These include the settings of the paleoclimate archives shown in Figure 1.1. In which of these setting(s) (A‐E3) would you expect to find relatively uninterrupted accumulation (or growth for biological archives)? Explain your answer.Examine the photos of a sedimentary rock outcrop, an ocean sediment core, and an ice core ( Figure 1.3). These could have originated from locations E1, E3, and C respectively in the block diagram ( Figure 1.2). FIGURE 1.3. Three paleoclimate archives. (a) A sedimentary outcrop from Bastrop, TX.(Source: photo courtesy of John Firth, IODP). (b) An ice core segment, ~9 cm wide (photo by Janine and Jim Eden, Flickr Creative Commons license as posted to https://www.dnr.wa.gov/programs‐and‐services/geology/glaciers#the‐cordilleran‐ice‐sheet.1.).(c) An ocean sediment core segment, ~7 cm wide; it was originally a cylinder that was cut in half lengthwise (from IODP, http://www.iodp.tamu.edu/publications199_IR/chap_13/chap_13.htm).
6 How are the sedimentary rock outcrop and ocean sediment core similar? How are they different?
7 How are the ice core and the ocean sediment core similar? How are they different?The quality of the paleoclimate record is also affected by what has happened to the archive since the initial recording (i.e., since the time when the archive was first formed or deposited). For example, as sediments can be lithified into sedimentary rock; rocks and sediments and the fossils they contain can be weathered and eroded; ice can melt; and organic matter can decay. All of these processes can degrade the information recorded and, therefore, increase uncertainty about the data and its interpretation. These processes also affect the maximum time range that an archive spans and therefore the time interval for which it is useful for paleoclimate reconstructions.The various types of proxy data must be described and interpreted by those who have learned how to “read” natural archives. This typically involves making observations and measurements using a wide range of analytical equipment (e.g. hand lens, microscopes, gas chromatographs, mass spectrometers). While we rely on the various proxy data to reconstruct paleoclimates, it is important to also recognize that each analytical method has its own limitations which can influence resolution, maximum time ranges, and scientific uncertainty.Examine the data in Table 1.1which summarize the typical (although exceptions certainly exist!) spatial and temporal distribution of each of the paleoclimate archives in Figure 1.1. Also included in Table 1.1are examples of the proxy data and climate parameters that can be reconstructed from these archives. Additional resources on each of these archives can be found in the supplementary materials associated with this book. In Table 1.1notice that lake sediments, marine sediments, and sedimentary rocks, while all sedimentary sequences, are displayed in separate rows in this table because of their distinctly different timeframes and temporal and spatial (geographic) resolutions ( Figure 1.4). TABLE 1.1.Selected major paleoclimate archives and the proxy data they contain.Adapted from Cronin (1999) Principles of Paleoclimatology, with information from Ruddiman (2008) Earth's Climate Past and Future, http://www.ncdc.noaa.gov/paleo, http://www.ngdc.noaa.gov/mgg/curator/curator.html, and https://www.ncei.noaa.gov.https://www.sciencemag.org/news/2017/08/record‐shattering‐27‐Myr‐old‐ice‐core‐reveals‐start‐ice‐agesArchiveGeographic Distribution & Number of Sites: Where are these records typically found? How many records have been collected? (see also Figure 1.4a,b)Time Range: How far back in time can we typically go? (years before present)Temporal Resolution: How detailed can we typically get? (years)Types of Proxy Data: What is typically measured and analyzed?Past Climate Conditions: What climatic information can the proxy data typically tell us about?ContinentalTree ringsGlobal, but most sites in the Northern Hemisphere; >6000 sites~10 000<1Cellulose; stable and radioactive isotopes; Ring widthsSeasonal precipitation; fires; and temperature; ageLake sedimentsGlobal, but most sites in the Northern Hemisphere; ~100 s of sites<1 000 0001–20Microfossils and pollen types and abundances; paleomagnetic patterns; stable and radioactive isotopes; trace elements; alkenone biomarkers; sediment composition and geochemistryRegional changes in precipitation and evaporation; temperature; salinity; volcanic activity; glacial activity; erosion rates; chemical weathering; ageSpeleothems (cave deposits)Global; >50 sites<500 0001–2000Stable and radioactive isotopes; trace elementsTemperature; precipitation, atmospheric CO2; ageIce sheets and glaciersPolar ice sheets, and high altitude (alpine) temperate and tropical glaciers; >80 sites<2 700 000<1–1000Stable and radioactive isotopes; trace elements; dust and other particulates; atmospheric gas concentrationsTemperature; precipitation; wind/atmospheric circulation; atmospheric chemistry including CO2; volcanic activity; biomass burning; ageSedimentary rocksGlobal; 10 s of thousands of sites<3 600 000 00010 000–100 000Microfossil and pollen types and abundances; paleomagnetic patterns; sediment composition; stable and radioactive isotopes; depositional patternsTemperature; biological productivity; volcanic activity; glacial activity; sea level; ice volume; evolution; chemical weathering; ageOceanicCoralsTropical and subtropical oceans, >60 sites<650 000<1–1000Growth bands; stable and radioactive isotopes; trace elementsSalinity; temperature; nutrients; sea level; ice volume; ageMarine sedimentsGlobal; >65 000 sites<200 000 000100–10 000Microfossil and pollen types and abundances; paleomagnetic patterns; stable and radioactive isotopes; trace elements; alkenone biomarkers; sediment composition; depositional patternsOcean and atmospheric circulation; temperature; salinity; nutrients; aridity on land; biological productivity; volcanic activity; glacial activity; ice volume; chemical weathering; age FIGURE 1.4. (a) Global geographic distribution of lake and ocean core sites. Different colors represent different ships (platforms). From National Centers for Environmental Information NOAA, https://maps.ngdc.noaa.gov/viewers/sample_index. (b) Global geographic distribution of sample locations for tree ring records (green triangles), coral records (yellow circles), ice cores (blue triangles), and speleothem records (gray circles). From National Centers for Environmental Information NOAA, https://gis.ncdc.noaa.gov/maps/ncei/paleo?layers=0000000000000001
Читать дальшеИнтервал:
Закладка:
Похожие книги на «Reconstructing Earth's Climate History»
Представляем Вашему вниманию похожие книги на «Reconstructing Earth's Climate History» списком для выбора. Мы отобрали схожую по названию и смыслу литературу в надежде предоставить читателям больше вариантов отыскать новые, интересные, ещё непрочитанные произведения.
Обсуждение, отзывы о книге «Reconstructing Earth's Climate History» и просто собственные мнения читателей. Оставьте ваши комментарии, напишите, что Вы думаете о произведении, его смысле или главных героях. Укажите что конкретно понравилось, а что нет, и почему Вы так считаете.


