Bhisham C. Gupta - Statistical Quality Control
Здесь есть возможность читать онлайн «Bhisham C. Gupta - Statistical Quality Control» — ознакомительный отрывок электронной книги совершенно бесплатно, а после прочтения отрывка купить полную версию. В некоторых случаях можно слушать аудио, скачать через торрент в формате fb2 и присутствует краткое содержание. Жанр: unrecognised, на английском языке. Описание произведения, (предисловие) а так же отзывы посетителей доступны на портале библиотеки ЛибКат.
- Название:Statistical Quality Control
- Автор:
- Жанр:
- Год:неизвестен
- ISBN:нет данных
- Рейтинг книги:4 / 5. Голосов: 1
-
Избранное:Добавить в избранное
- Отзывы:
-
Ваша оценка:
Statistical Quality Control: краткое содержание, описание и аннотация
Предлагаем к чтению аннотацию, описание, краткое содержание или предисловие (зависит от того, что написал сам автор книги «Statistical Quality Control»). Если вы не нашли необходимую информацию о книге — напишите в комментариях, мы постараемся отыскать её.
Provides a basic understanding of statistical quality control (SQC) and demonstrates how to apply the techniques of SQC to improve the quality of products in various sectors Statistical Quality Control: Using MINITAB, R, JMP and Python
Statistical Quality Control: Using MINITAB, R, JMP and Python
Statistical Quality Control — читать онлайн ознакомительный отрывок
Ниже представлен текст книги, разбитый по страницам. Система сохранения места последней прочитанной страницы, позволяет с удобством читать онлайн бесплатно книгу «Statistical Quality Control», без необходимости каждый раз заново искать на чём Вы остановились. Поставьте закладку, и сможете в любой момент перейти на страницу, на которой закончили чтение.
Интервал:
Закладка:
8 Chapter 9Table 9.1a Probability of acceptance with various fraction of lot defective.Table 9.1b Acceptance probabilities and AOQ% vs. lot percent defective.Table 9.2  ,
,  ,
,  , p aprobabilities and AOQ% vs. lot percent defective p Table 9.3 Item‐by‐item sequential‐sampling plan with α = 0.05, p 1= .02, β = 0...Table 9.4 ANSI/ASQ Z1.4‐2003 Table VIII: Limit numbers for reduced inspection...Table 9.5 ANSI/ASQ Z1.4‐2003 Table I: Sample size code lettersTable 9.6 ANSI/ASQ Z1.4‐2003 Table II‐A: Single‐sampling plans for normal ins...Table 9.7 ANSI/ASQ Z1.4‐2003 Table III‐A: Double‐sampling plans for normal in...Table 9.8 ANSI/ASQ Z1.4‐2003 Table IV‐A: Multiple sampling plans for normal i...Table 9.9 ANSI/ASQ Z1.9‐2003 Table A‐2 *: Sample size code letters **Table 9.10 ANSI/ASQ Z1.9‐2003 Table C‐1: Master table for normal and tightene...Table 9.11 ANSI/ASQ Z1.9‐2003 Table B‐3: Master table for normal and tightene...Table 9.12 ANSI/ASQ Z1.9‐2003 Table B‐5: Table for estimating the lot percent...
9 Appendix A Table A.1Random numbers. Table A.2Factors helpful in constructing control charts for variables. Table A.3Values of K 1for computing repeatability using the range method. Table A.4Values of K 2for computing reproducibility using the range method. Table A.5Binomial probabilities 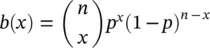 . Table A.6Poisson probabilities
 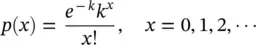 . Table A.7Standard normal distribution. Table A.8Critical values of χ 2with ν degrees of freedom. Table A.9Critical values of t with ν degrees of freedom.
List of Illustrations
1 Chapter 1 Figure 1.1 Flow chart of a process. Figure 1.2 A chain reaction chart used by the Japanese companies in their to... Figure 1.3 Detecting practical and statistical differences.
2 Chapter 2 Figure 2.1 Six Sigma project selection. Figure 2.2 Flow chart of a process. Figure 2.3 The DMAIC cycle. Figure 2.4 The standard normal distribution curve. Figure 2.5 For a normally distributed characteristic, centered at specificat... Figure 2.6 Applying the 1.5σ shift to a centered 6σ process.
3 Chapter 3 Figure 3.1 Classifications of statistical data. Figure 3.2 Dot plot for the data on defective parts received in 24 shipments... Figure 3.3 Pie chart for defects associated with manufacturing process steps... Figure 3.4 Bar chart for the data in Example 3.6. Figure 3.5 Bar chart for the data in Example 3.7. Figure 3.6 Bar chart for the data in Example 3.8. Figure 3.7 Frequency histogram for the data in Example 3.9. Figure 3.8 Line graph for the data on flu vaccines given in Example 3.10.Figure 3.9 Minitab scatterplots showing four different degrees of correlatio...Figure 3.10 Two frequency distribution curves with equal mean, median, and m...Figure 3.11 Illustration of the empirical rule.Figure 3.12 Amount of soft drink contained in a bottle.Figure 3.13 Dollar value of units of bad production.Figure 3.14 Box-and-whisker plot.Figure 3.15 Box plot for the data in Example 3.25.Figure 3.16 The normal density function curve with μ = 0 and σ = 1.Figure 3.17 Curves representing the normal density function with different m...Figure 3.18 Curves representing the normal density function with different s...Figure 3.19 The standard normal density function curve.Figure 3.20 Probability (a ≤ Z ≤ b) under the standard normal curve.Figure 3.21 Shaded area equal to P(1 ≤ Z ≤ 2)Figure 3.22 Two shaded areas showing P(–1.50 ≤ Z ≤ 0) = P(0 ≤ Z ≤ 1.50).Figure 3.23 Two shaded areas showing P(–2.2 ≤ Z ≤ –1.0) = P(1.0 ≤ Z ≤ 2.2.Figure 3.24 Minitab normal probability plot for the data in Example 3.35.
4 Chapter 5Figure 5.1 Pareto chart for the data in Example 5.1.Figure 5.2 Pareto chart when weighted frequencies are used.Figure 5.3 An initial form of a cause‐and‐effect diagram.Figure 5.4 A complete cause‐and‐effect diagram.Figure 5.5 A damaged item shaped like a rectangular prism.Figure 5.6 Run chart.Figure 5.7 A pictorial representation of a Shewhart control chart with UCL a...Figure 5.8 OC curves for an  control chart with three‐sigma control limits ...Figure 5.9 Minitab printout of
  and R control charts for the data on bolts ...Figure 5.10 The MR control chart constructed using Minitab for the data in T...Figure 5.11 The
  and S control charts, constructed using Minitab, for the d...Figure 5.12
  and S control charts for variable sample sizes, constructed us...Figure 5.13 (a) Process is stable but not capable; (b) process is stable and...
5 Chapter 6Figure 6.1 Minitab printout of the p control chart for the data on nonconfor...Figure 6.2 p chart for nonconforming APLs with variable sample sizes.Figure 6.3 np control chart for the data on nonconforming APLs in Table 6.2....Figure 6.4 C control chart of nonconformities for the data in Table 6.4.Figure 6.5 u control chart of nonconformities for the data in Table 6.5.Figure 6.6 u control chart for the data on nonconformities in circuit boards...
6 Chapter 7Figure 7.1  control chart for the data in Table 7.1.Figure 7.2 CUSUM chart for the data in Table 7.1.Figure 7.3 Minitab printout of a two‐sided CUSUM control chart for the data ...Figure 7.4
  control chart for individual values in Table 7.4.Figure 7.5 CUSUM control chart for individual values in Table 7.4.Figure 7.6 Two‐sided CUSUM control chart using the FIR feature for the data ...Figure 7.7 Two‐sided CUSUM control chart using the FIR feature for the data ...Figure 7.8 Minitab printout MA control chart for the data in Table 7.7.Figure 7.9 Minitab printout of the EWMA control chart for the data in Table ...
7 Chapter 8Figure 8.1 Normal distribution graph showing the percentage of nonconforming...Figure 8.2 A barely capable process.Figure 8.3 Relationships among the SQC tools.Figure 8.4 Pre‐control zones.Figure 8.5 Standard normal curve with each yellow zone approximately 7%.Figure 8.6 Standard normal curve showing a barely capable process.Figure 8.7 Components of total variation.Figure 8.8 (a) Accurate and precise; (b) accurate but not precise; (c) not a...Figure 8.9 Diagram showing the linear relationship between actual and observ...Figure 8.10 Percent contribution of variance components for the data in Exam...Figure 8.11 Interaction between operators and parts for the data in Example ...Figure 8.12 Scatter plot for measurements vs. operators.Figure 8.13 Scatter plot for measurements vs. parts.
Читать дальшеИнтервал:
Закладка:
Похожие книги на «Statistical Quality Control»
Представляем Вашему вниманию похожие книги на «Statistical Quality Control» списком для выбора. Мы отобрали схожую по названию и смыслу литературу в надежде предоставить читателям больше вариантов отыскать новые, интересные, ещё непрочитанные произведения.


Обсуждение, отзывы о книге «Statistical Quality Control» и просто собственные мнения читателей. Оставьте ваши комментарии, напишите, что Вы думаете о произведении, его смысле или главных героях. Укажите что конкретно понравилось, а что нет, и почему Вы так считаете.