Bhisham C. Gupta - Statistical Quality Control
Здесь есть возможность читать онлайн «Bhisham C. Gupta - Statistical Quality Control» — ознакомительный отрывок электронной книги совершенно бесплатно, а после прочтения отрывка купить полную версию. В некоторых случаях можно слушать аудио, скачать через торрент в формате fb2 и присутствует краткое содержание. Жанр: unrecognised, на английском языке. Описание произведения, (предисловие) а так же отзывы посетителей доступны на портале библиотеки ЛибКат.
- Название:Statistical Quality Control
- Автор:
- Жанр:
- Год:неизвестен
- ISBN:нет данных
- Рейтинг книги:4 / 5. Голосов: 1
-
Избранное:Добавить в избранное
- Отзывы:
-
Ваша оценка:
Statistical Quality Control: краткое содержание, описание и аннотация
Предлагаем к чтению аннотацию, описание, краткое содержание или предисловие (зависит от того, что написал сам автор книги «Statistical Quality Control»). Если вы не нашли необходимую информацию о книге — напишите в комментариях, мы постараемся отыскать её.
Provides a basic understanding of statistical quality control (SQC) and demonstrates how to apply the techniques of SQC to improve the quality of products in various sectors Statistical Quality Control: Using MINITAB, R, JMP and Python
Statistical Quality Control: Using MINITAB, R, JMP and Python
Statistical Quality Control — читать онлайн ознакомительный отрывок
Ниже представлен текст книги, разбитый по страницам. Система сохранения места последней прочитанной страницы, позволяет с удобством читать онлайн бесплатно книгу «Statistical Quality Control», без необходимости каждый раз заново искать на чём Вы остановились. Поставьте закладку, и сможете в любой момент перейти на страницу, на которой закончили чтение.
Интервал:
Закладка:
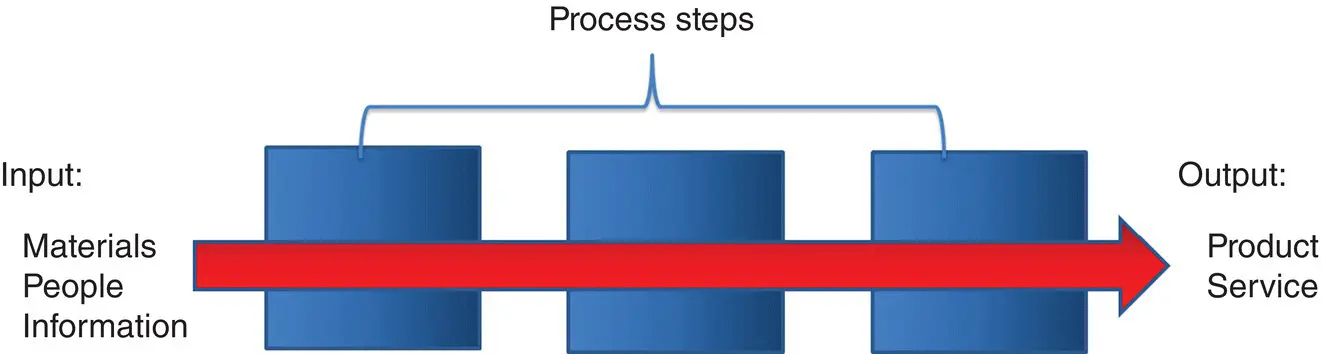
Figure 2.2 Flow chart of a process.
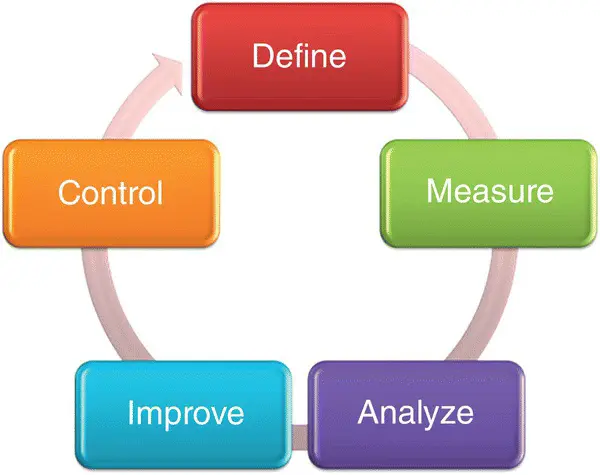
Figure 2.3 The DMAIC cycle.
In the Define phase , a team sifts through customer feedback and product performance metrics to craft project problem and goal statements and establish baseline measures. Labor, material, and capital resources required by the project are identified, and a rough timeline for project milestones is created. This information is collected into a project charter that is approved by upper management.
During the Measure phase , the team identifies important metrics and collects additional data to help describe the nature of the problem.
In the Analyze phase, the team uses statistical and graphical techniques to identify the variables that are major drivers of the problem. In this stage, root causes of the problem are identified.
In the Improve phase , the team identifies ways to address the root cause(s) and prioritizes the potential solutions. Then, changes to the process are designed, tested, and then implemented.
In the final Control phase , the team works to create a plan to prevent the newly improved process from backsliding to previous levels of defects. Mechanisms for ongoing monitoring and control of key variables are also established at this point. During the project wrap‐up, the team’s success is celebrated, and the lessons that the team learned during the project are shared throughout the company so that other teams can benefit from their discoveries.
2.2.3 Six Sigma as a Statistical Standard of Quality
The third definition of Six Sigma refers to a level of quality that produces very few defects in the long term. With this definition, Six Sigma is often written using the numeral 6 and the Greek letter sigma: 6σ.
Bill Smith devised this standard of quality at Motorola in 1986. According to Smith’s definition, over the long run, a process running at a 6σ level will produce 3.4 defects per million opportunities (DPMO). To achieve this extremely high level of quality, a process must produce outputs that consistently meet the target specifications. Producing outputs with very small variability around the target is the key to achieving Six Sigma quality. With such tight control over variability, even if the process drifts from the target over time, the output will still meet specifications and achieve the 3.4 DPMO standard.
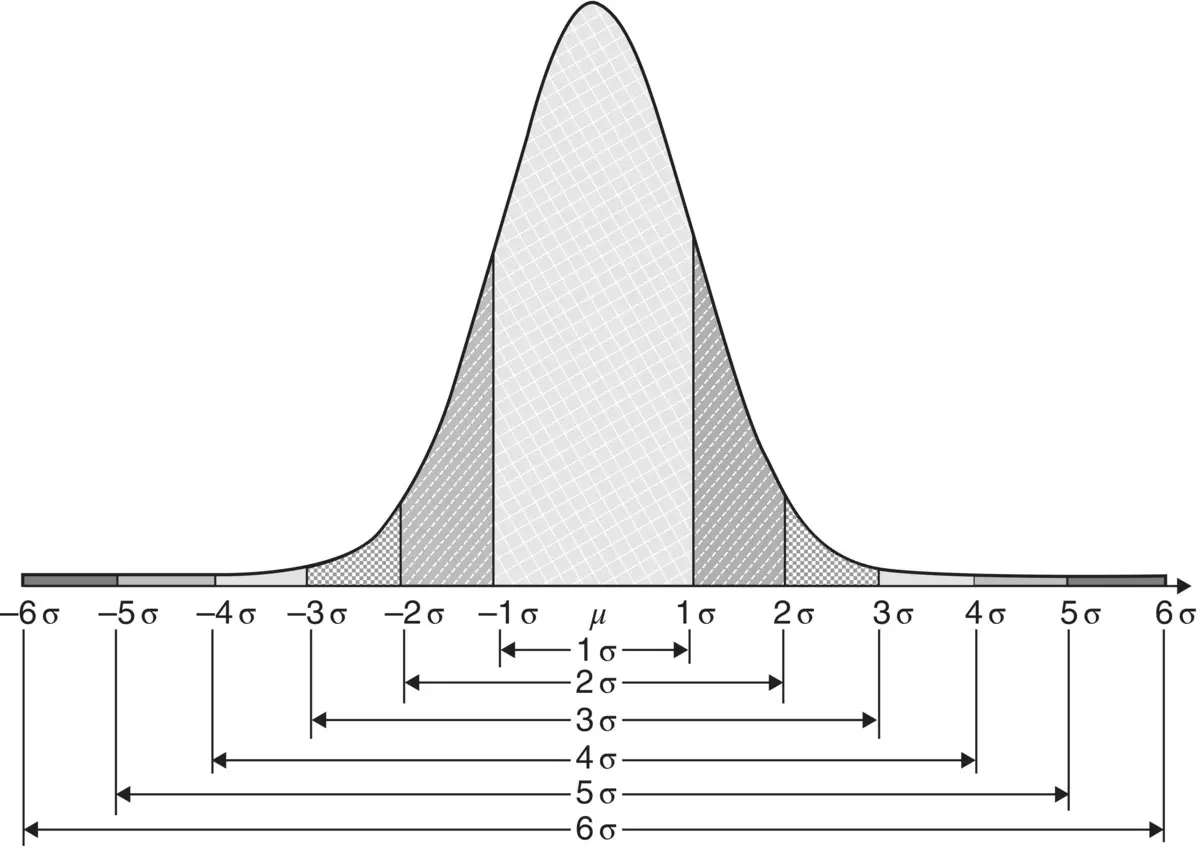
Figure 2.4 The standard normal distribution curve.
As might be expected given this extremely high standard for quality, most processes are not running at a 6σ quality level. In fact, in most organizations, processes are running at the 3σ level, which translates into about 67,000 DPMO.
2.2.3.1 Statistical Basis for Six Sigma
The Six Sigma standard of quality has its basis in normal distribution theory (see Figure 2.4). We assume that the quality characteristic of interest – say, the diameter of a metal shaft – is normally distributed. The corresponding engineering specifications are assumed to be symmetric, and the process is centered at the specification target value.
For a centered process, 6σ quality is achieved when the lower and upper specifications map to ± six standard deviations from the mean, as shown in Figure 2.5. The centered process would produce approximately 2.0 defects per billion opportunities.
We then assume that no matter how well our process currently meets specifications, in the long run, the output will drift based on factors such as machine wear, incoming material variation, supplier changes, and operator variability. The assumption in Six Sigma is that even a well‐behaved process will drift from the target, perhaps by as much as 1.5 standard deviations. By applying this 1.5 sigma shift to a centered process, the rationale is that companies can gain a more realistic view of the quality level their customers will experience over the long term.
After adding a 1.5 sigma shift to a centered process, as shown in Figure 2.6, we then use a normal distribution table to calculate the fraction of parts that fall outside the specification limits. Thus the 6σ defect rate is equal to 3.4 DPMO after the shift in the mean . Table 2.1lists the DPMO rates for various sigma levels for centered and shifted processes.
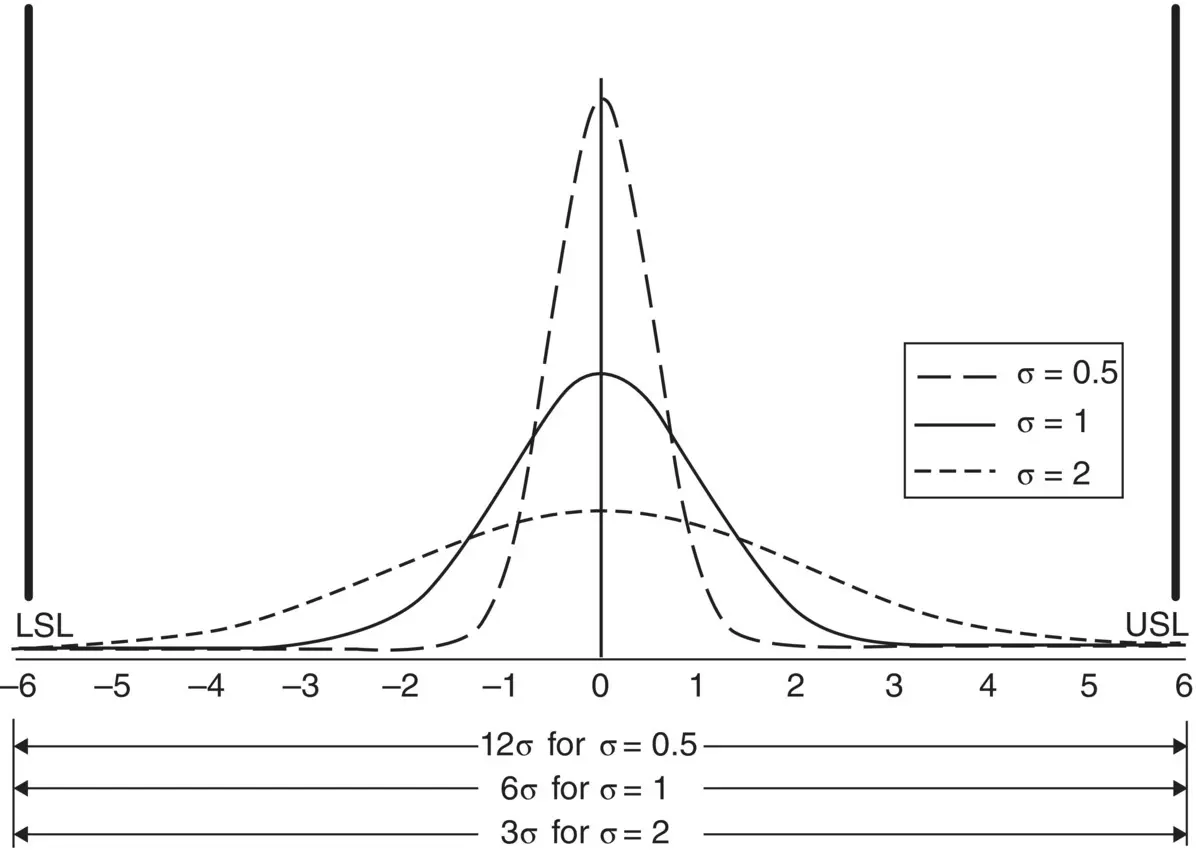
Figure 2.5 For a normally distributed characteristic, centered at specification target, 6 σ quality is achieved when the lower and upper specifications map to ±6 σ .
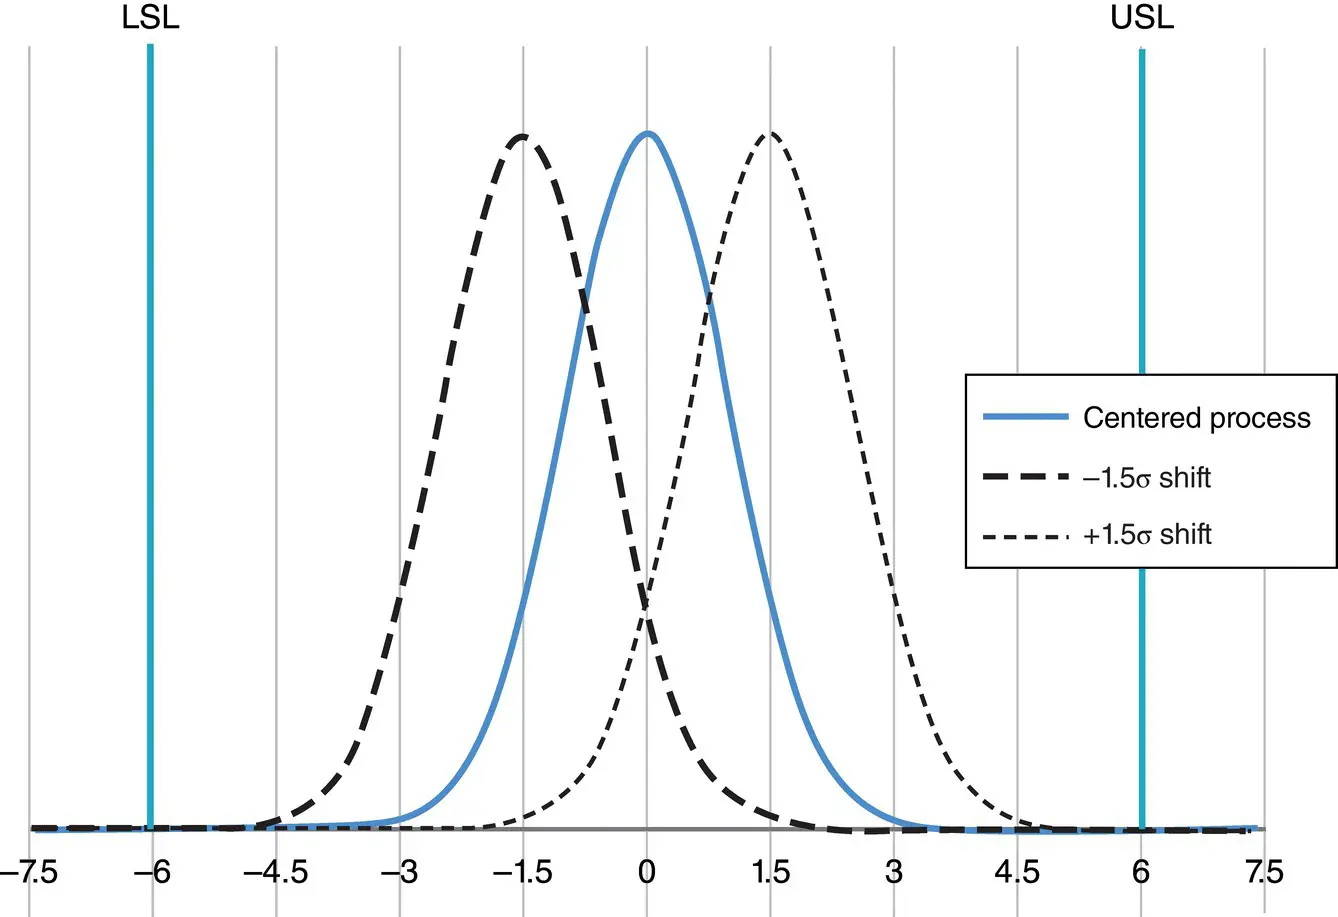
Figure 2.6 Applying the 1.5σ shift to a centered 6σ process.
Table 2.1 Defects per million opportunities (DPMO) for various sigma levels; centered and 1.5σ shifted processes.
| DPMO | ||
|---|---|---|
| Sigma | Centered Process | 1.5 sigma shift |
| 6.0 | 0.00 | 3.4 |
| 5.0 | 0.57 | 232.6 |
| 4.0 | 63.34 | 6209.7 |
| 3.0 | 2699.80 | 66,811 |
| 2.0 | 45,500.26 | 308,770 |
| 1.0 | 317,310.51 | 697,672 |
2.2.4 Six Sigma Roles
As an enterprise‐wide system, it follows that Six Sigma deployment requires the efforts of a cross‐section of people filling various roles. These roles include Executive, Champion or Sponsor, Process Owner, and the Belt‐holders.
An Executive is vital to the success of a Six Sigma implementation. Since the program is driven from the top down, executives must show support through their communications and actions. Without key support, the program will fade.
A Champion or Sponsor is a top‐level manager familiar with Six Sigma principles who works with a project team. The champion’s role is to support the team by providing necessary resources and removing roadblocks when they occur. A champion does not attend every team meeting but will check in at major project phases and serve as a go‐to when the team needs top management support.
A Process Owner is a manager who is responsible for all aspects of a process and who also has the authority to make changes to the process. The process owner is a key member of a Six Sigma project team and often serves as a team leader.
If you are new to Six Sigma, you might be a bit confused by quality being described using a karate metaphor. It is admittedly a bit strange. Mikel Harry at Motorola is credited for coining the “belt” term. As the story goes, a plant manager told Harry that the Six Sigma tools he was applying were “kicking the hell out of variation” [4]. In Harry’s mind, the comment conjured an image of a ninja who could expertly wield tools to make the data reveal what it knows about a process. Hence the “belt” nomenclature was born.
Читать дальшеИнтервал:
Закладка:
Похожие книги на «Statistical Quality Control»
Представляем Вашему вниманию похожие книги на «Statistical Quality Control» списком для выбора. Мы отобрали схожую по названию и смыслу литературу в надежде предоставить читателям больше вариантов отыскать новые, интересные, ещё непрочитанные произведения.


Обсуждение, отзывы о книге «Statistical Quality Control» и просто собственные мнения читателей. Оставьте ваши комментарии, напишите, что Вы думаете о произведении, его смысле или главных героях. Укажите что конкретно понравилось, а что нет, и почему Вы так считаете.