Frede Blaabjerg - Smart Grid and Enabling Technologies
Здесь есть возможность читать онлайн «Frede Blaabjerg - Smart Grid and Enabling Technologies» — ознакомительный отрывок электронной книги совершенно бесплатно, а после прочтения отрывка купить полную версию. В некоторых случаях можно слушать аудио, скачать через торрент в формате fb2 и присутствует краткое содержание. Жанр: unrecognised, на английском языке. Описание произведения, (предисловие) а так же отзывы посетителей доступны на портале библиотеки ЛибКат.
- Название:Smart Grid and Enabling Technologies
- Автор:
- Жанр:
- Год:неизвестен
- ISBN:нет данных
- Рейтинг книги:3 / 5. Голосов: 1
-
Избранное:Добавить в избранное
- Отзывы:
-
Ваша оценка:
Smart Grid and Enabling Technologies: краткое содержание, описание и аннотация
Предлагаем к чтению аннотацию, описание, краткое содержание или предисловие (зависит от того, что написал сам автор книги «Smart Grid and Enabling Technologies»). Если вы не нашли необходимую информацию о книге — напишите в комментариях, мы постараемся отыскать её.
Smart Grid and Enabling Technologies
Smart Grid and Enabling Technologies
Smart Grid and Enabling Technologies — читать онлайн ознакомительный отрывок
Ниже представлен текст книги, разбитый по страницам. Система сохранения места последней прочитанной страницы, позволяет с удобством читать онлайн бесплатно книгу «Smart Grid and Enabling Technologies», без необходимости каждый раз заново искать на чём Вы остановились. Поставьте закладку, и сможете в любой момент перейти на страницу, на которой закончили чтение.
Интервал:
Закладка:
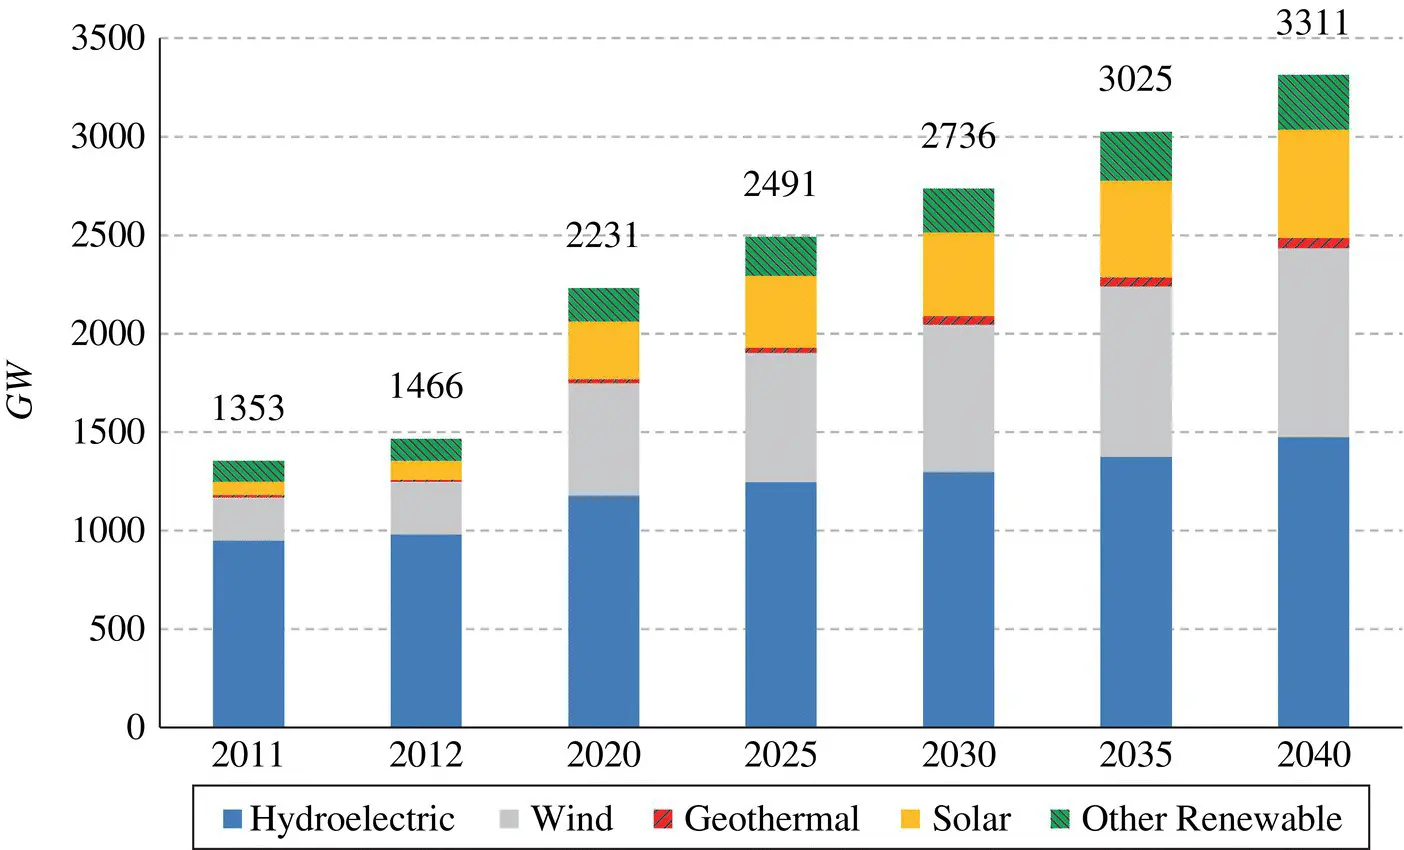
Figure 2.24 Predicted world total installed renewable generating capacity, 2011–2040, Adapted from [56].
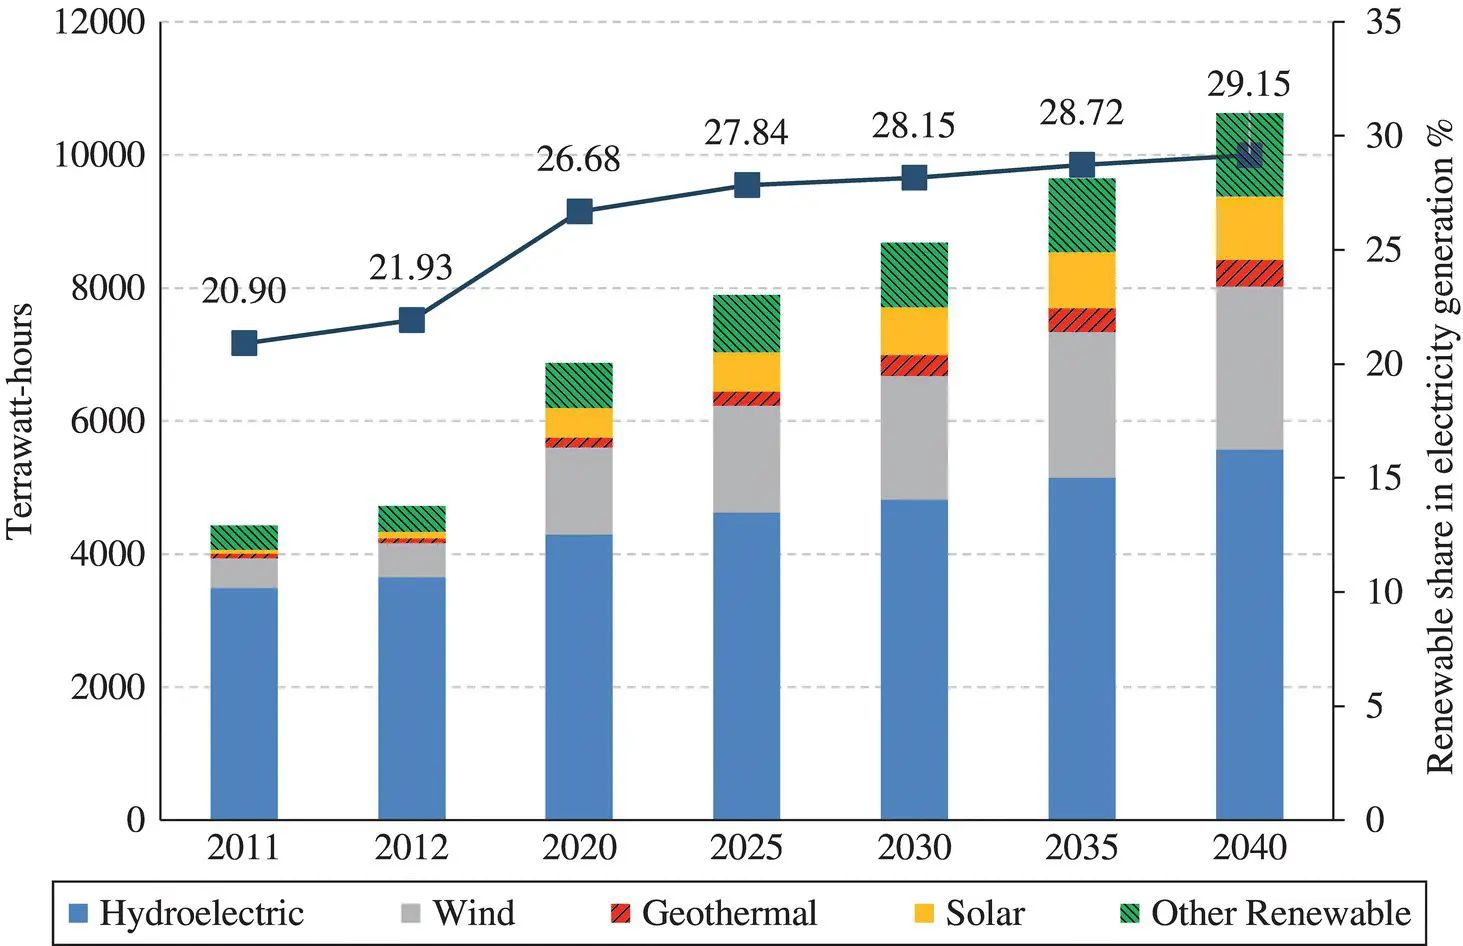
Figure 2.25 Predicted world renewable electricity generation and their global share, 2011–2040, Adapted from [56].
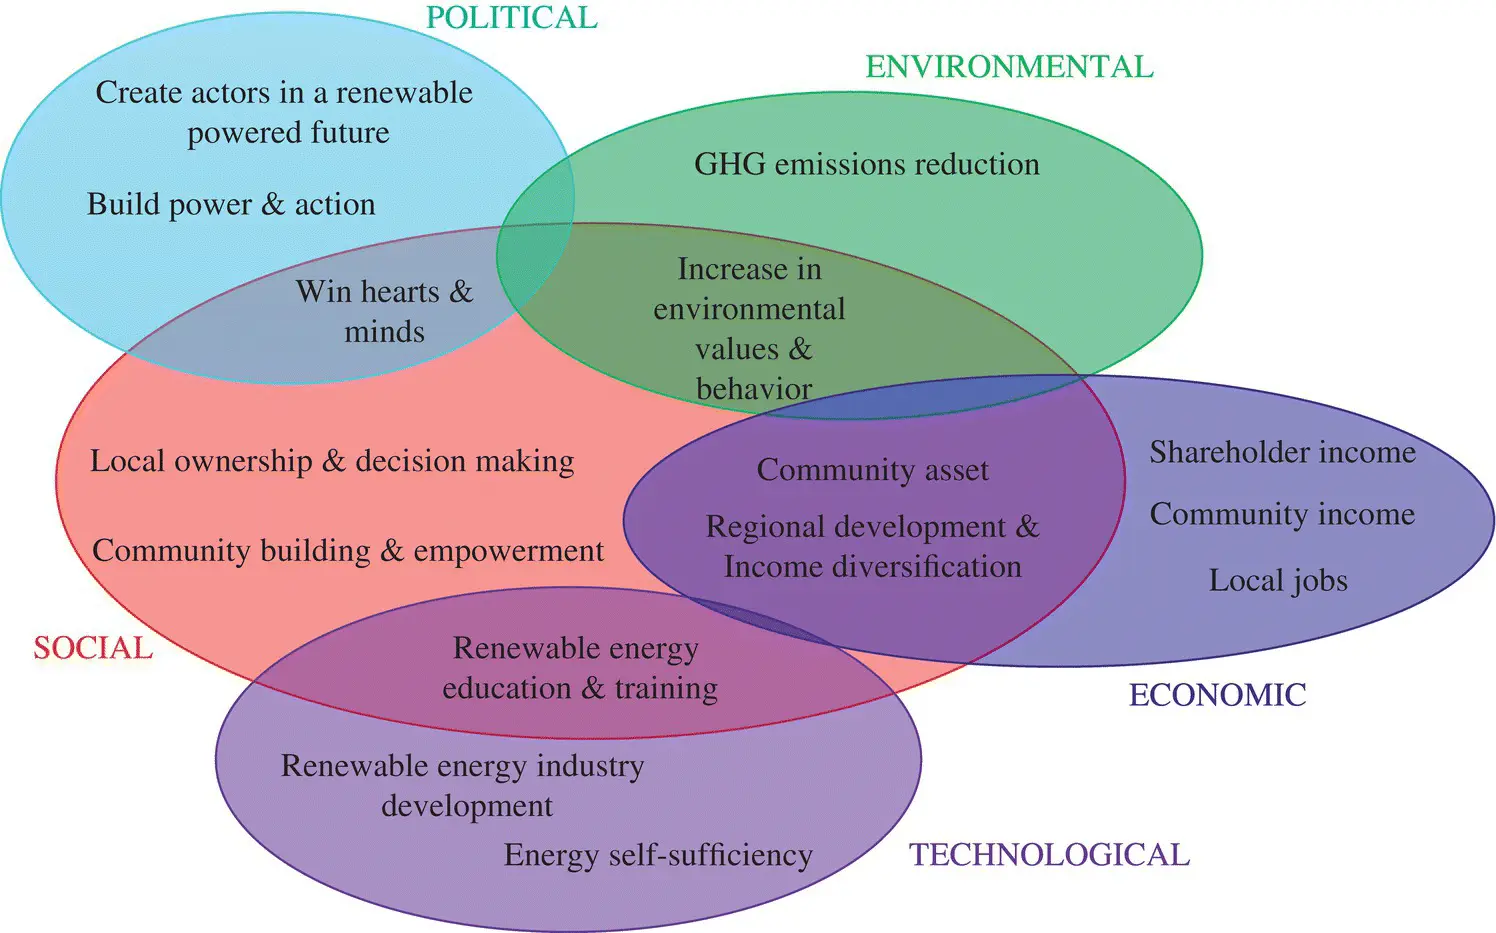
Figure 2.26 Potential features of renewable energy sources integration.
World‐wide investment in renewables exclusive of hydro decreased by 23% to $241.6 billion, the lowest total since 2013, yet, a record integration of renewable energy capacity worldwide in 2016. Wind, solar, biomass and waste‐to‐energy, geothermal, small hydro and marine sources among them contributed to an increase amounting to 138.5 GW, up from 127.5 GW in the previous year. This 2016‐Gigawatt figure was almost 55% of all the producing capacity included globally, the greatest number to date. Installations increased in spite of the fact that the money invested declined because of the drastic drop in capital costs for solar PV, onshore and offshore wind. Figure 2.27shows the trend of global new investment since 2004 in renewable energy. Moreover, the R&D investment levels for renewables in recent years are rising from private and governmental sectors as illustrated in Figure 2.28, [57, 58].
RES is attracting greater investments than fossil fuels. This suggests that green power is getting a large share of world capacity and generation, and could also be because the price of the project to produce energy from wind, solar, geothermal and small hydro is upfront. Fossil fuel plants cost less money to construct but have higher running costs, as the fuel has to be bought on a regular basis. Trade in renewable energy equipment and other investment goods and services will rise due to the scaled‐up employment in power and end‐use sectors. At the same time, this will decrease trade in other energy sources, particularly fossil fuels, which then can last longer for the earth. Therefore, due to the continuous employment in power and end‐use industries, trade in clean energy equipment and other investment products and service would rise. In comparison, the trade in alternative energy sources, particularly fossil oil, would decrease, which will be continued for a long time.
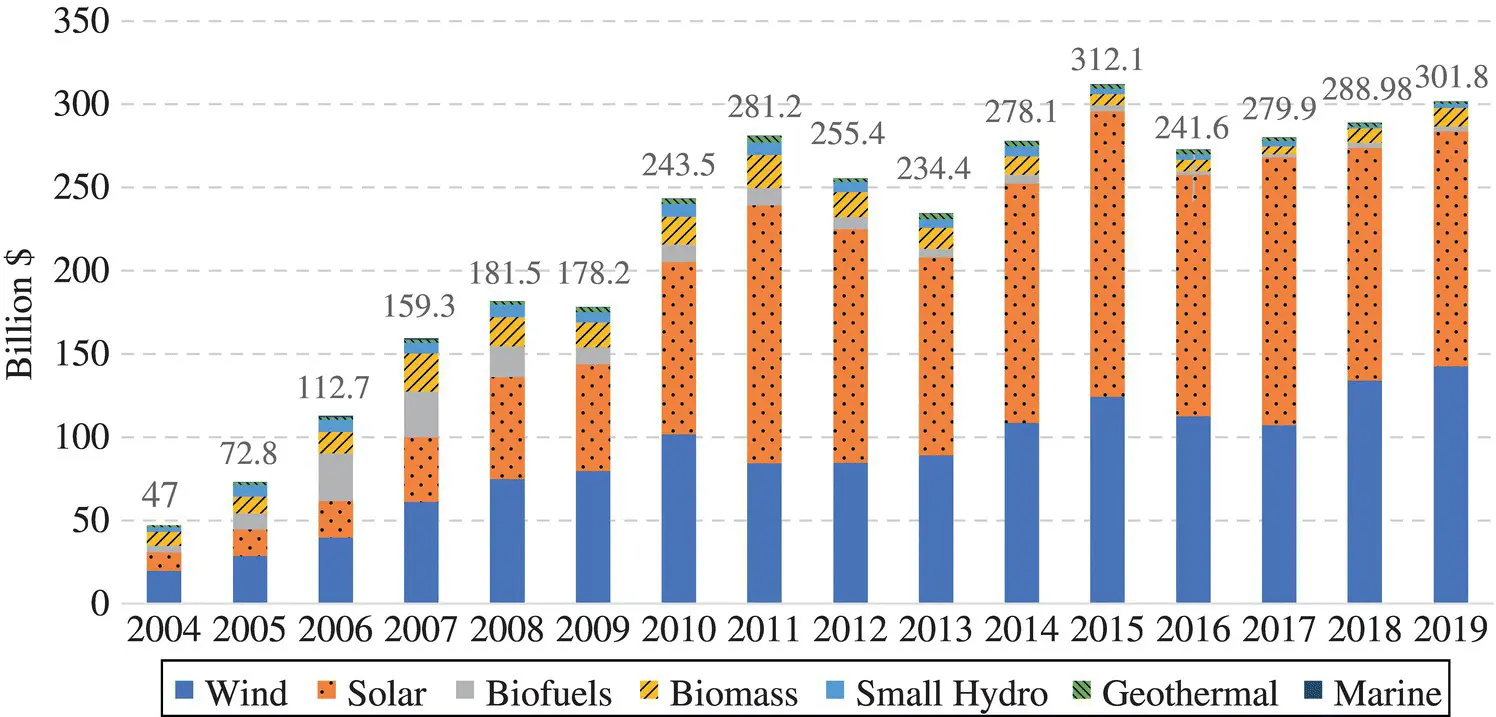
Figure 2.27 Financial investments in renewable energy by technology, 2004–2019, Adapted from [57].
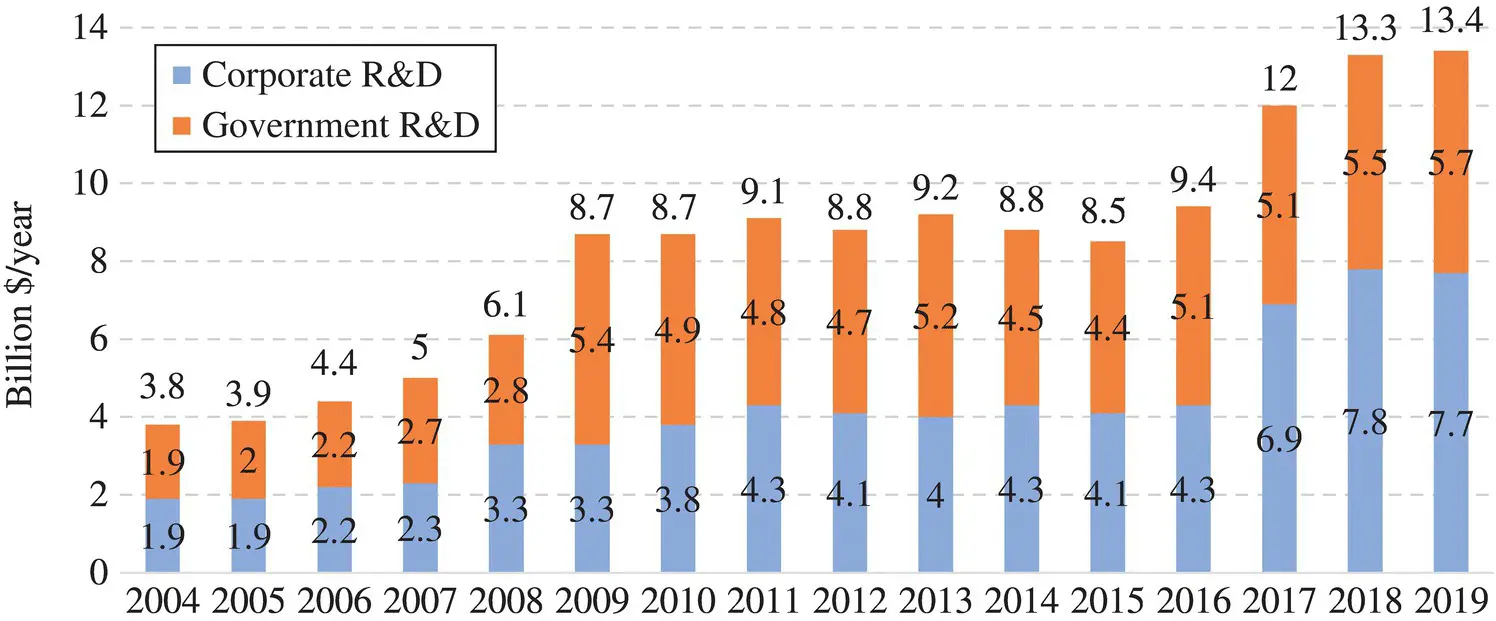
Figure 2.28 Research and development costs on renewable energy, 2004–2019, Adapted from [57].
The benefits of integrating RES are enormous especially in social and environmental levels. The environmental advantages include Greenhouse gas emission reduction and pollution decrease. The number of jobs created from RE integration significantly rose over the last few years. The PV sector has the lion’s share by 3.6 created jobs as shown in Figure 2.29followed by wind power by 1.16 million jobs. China is the largest RES manufacturer in the world with ever‐growing twin of energy supply and demand which made it a leader in this alternative transition. The employment rate will be extended from 9.2 to 24.4 million in 2030 [59].
Figure 2.30shows a diagram of a renewable energy market development. Technological influence plays a vital role in the dynamics of renewable energy advancement; hence, efficiency and effectiveness of investments are determined, mainly the cost and maturity of a certain technology. Moreover, through time and the utilization of a technology rises, costs will be decreased. During this development process, the government is helpful in many ways, for instance, in supporting capacity expansions, setting regulations, and adopting worldwide implementation of renewable energy. Furthermore, market and consumers' satisfaction influence the producers of renewable energy in competing with conventional energy producers. Yet, financially, requirements are met with respect to profitability levels, estimated prices, demand, and costs. The market development process must also consider capacity expansion and short‐ to long‐term production planning. Lastly, the equipment utilized in renewable resources and its lifetime must be taken into account during this process [9].
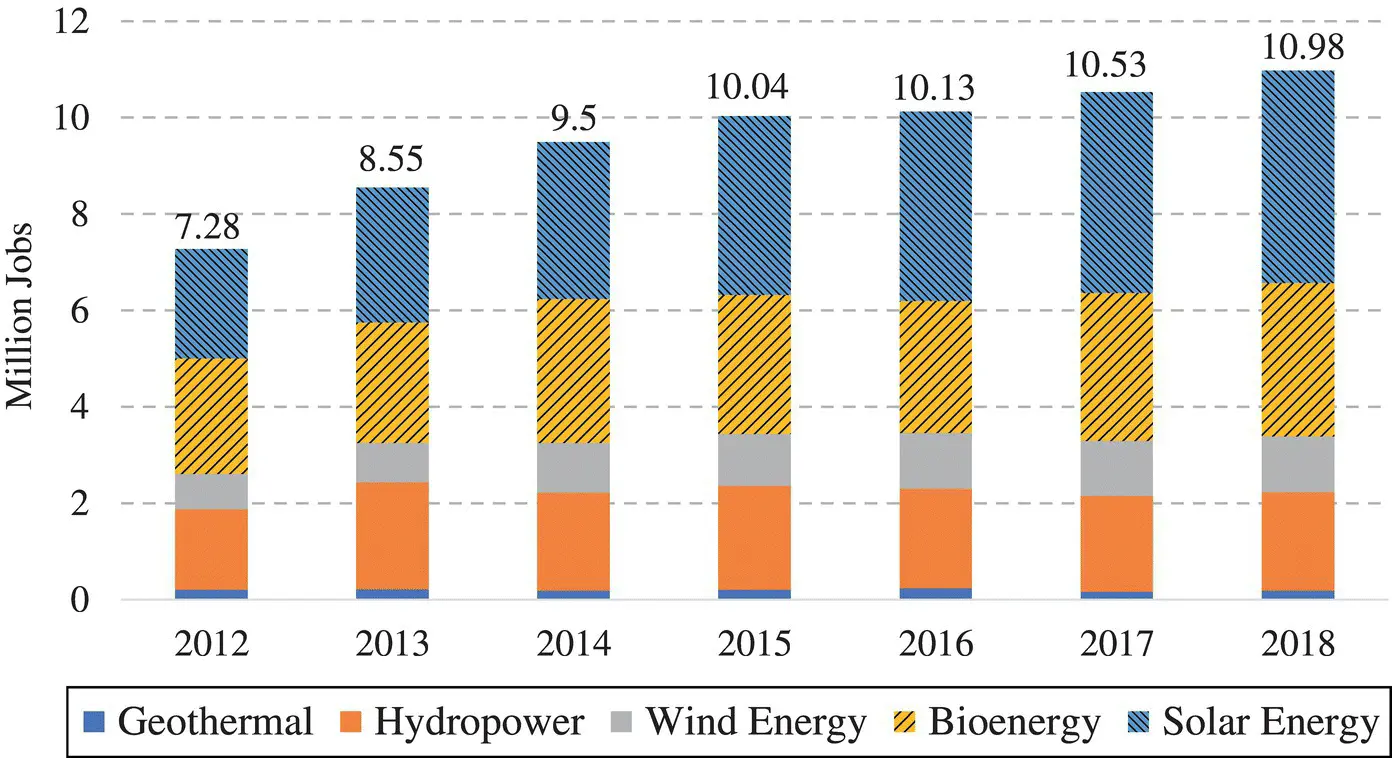
Figure 2.29 Global employment in renewable energy 2011–2018, Adapted from [59].
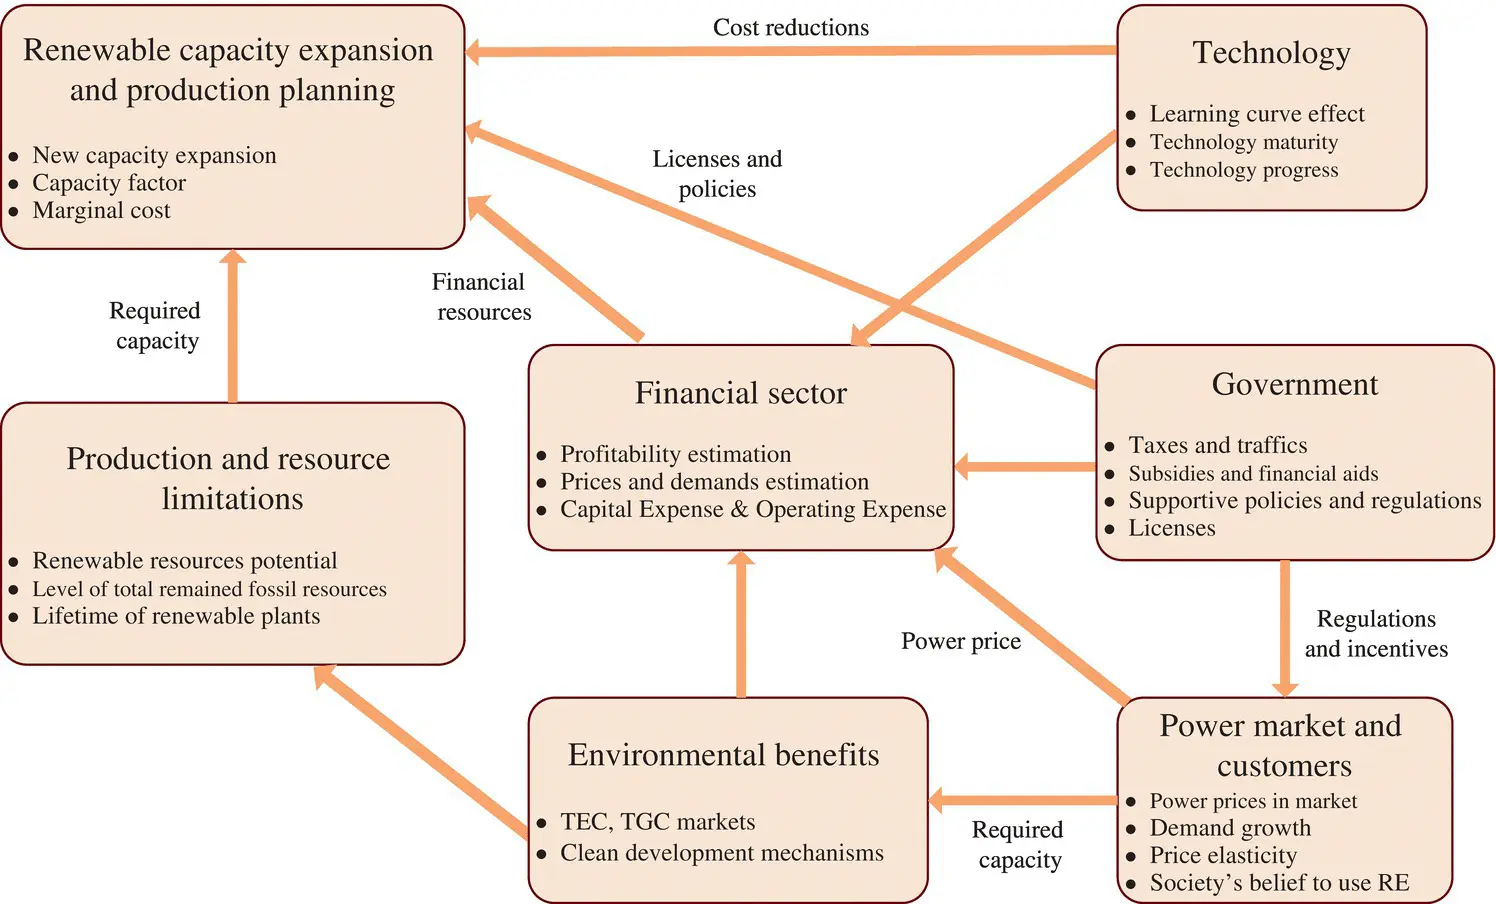
Figure 2.30 Renewable energy market development process, [9]. Reproduced with permission from ELSEVIER.
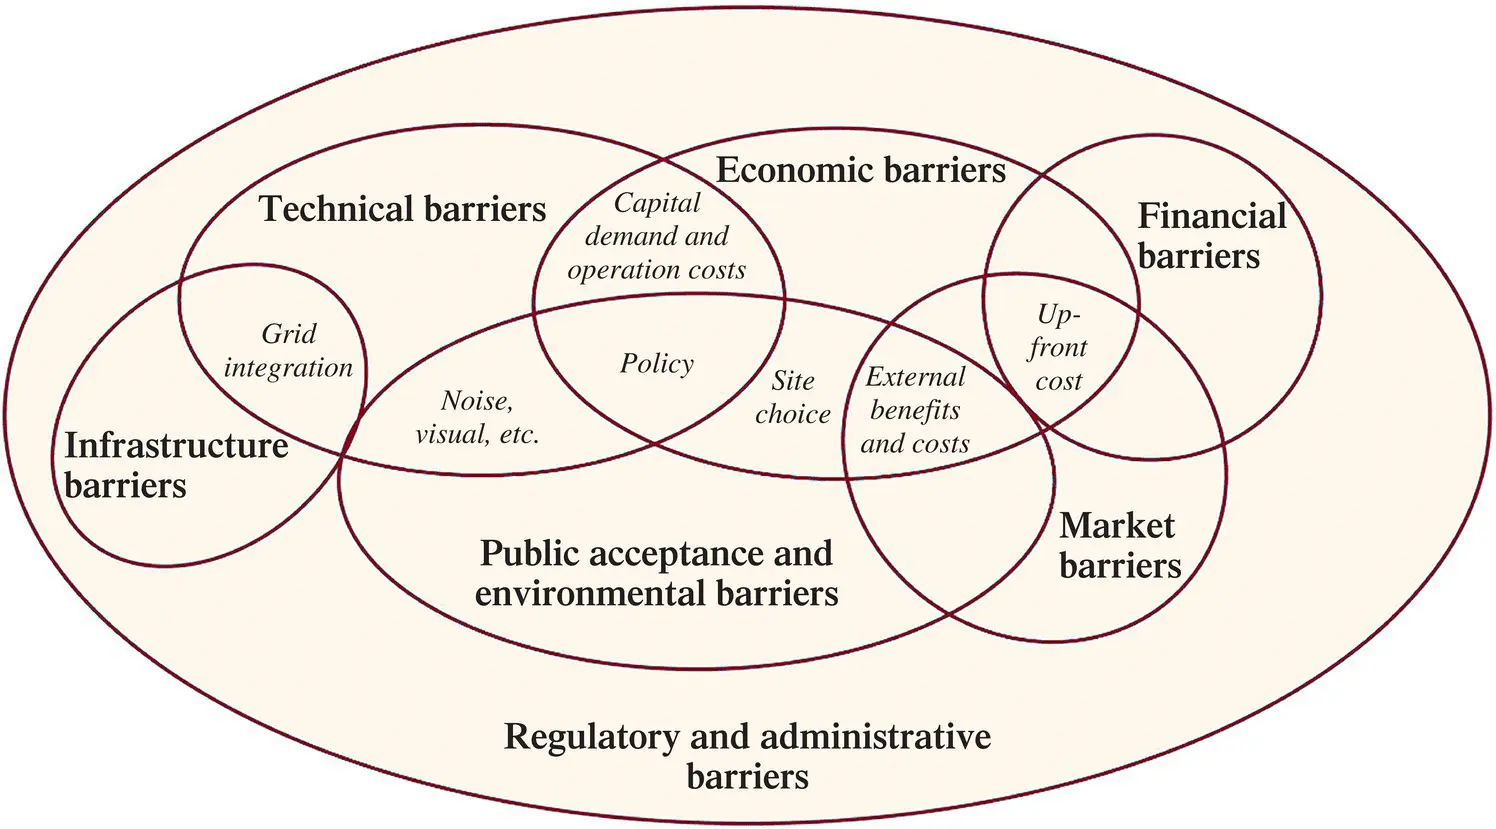
Figure 2.31 Barriers to renewable energy technology deployment.
The issues associated with implementing renewable energies can be summarized as shown in Figure 2.31. An economic barrier arises if the cost of a given technology is more than the cost of competing alternatives, even under optimal market conditions, with a direct connection between technological maturity and economic barriers. All other types of barriers are categorized as non‐economic, although these barriers play a vital role in determining the cost of renewables. The importance of the barriers depends on the technology and market, and the priority varies as a technology matures along the direction to commercialization, [9].
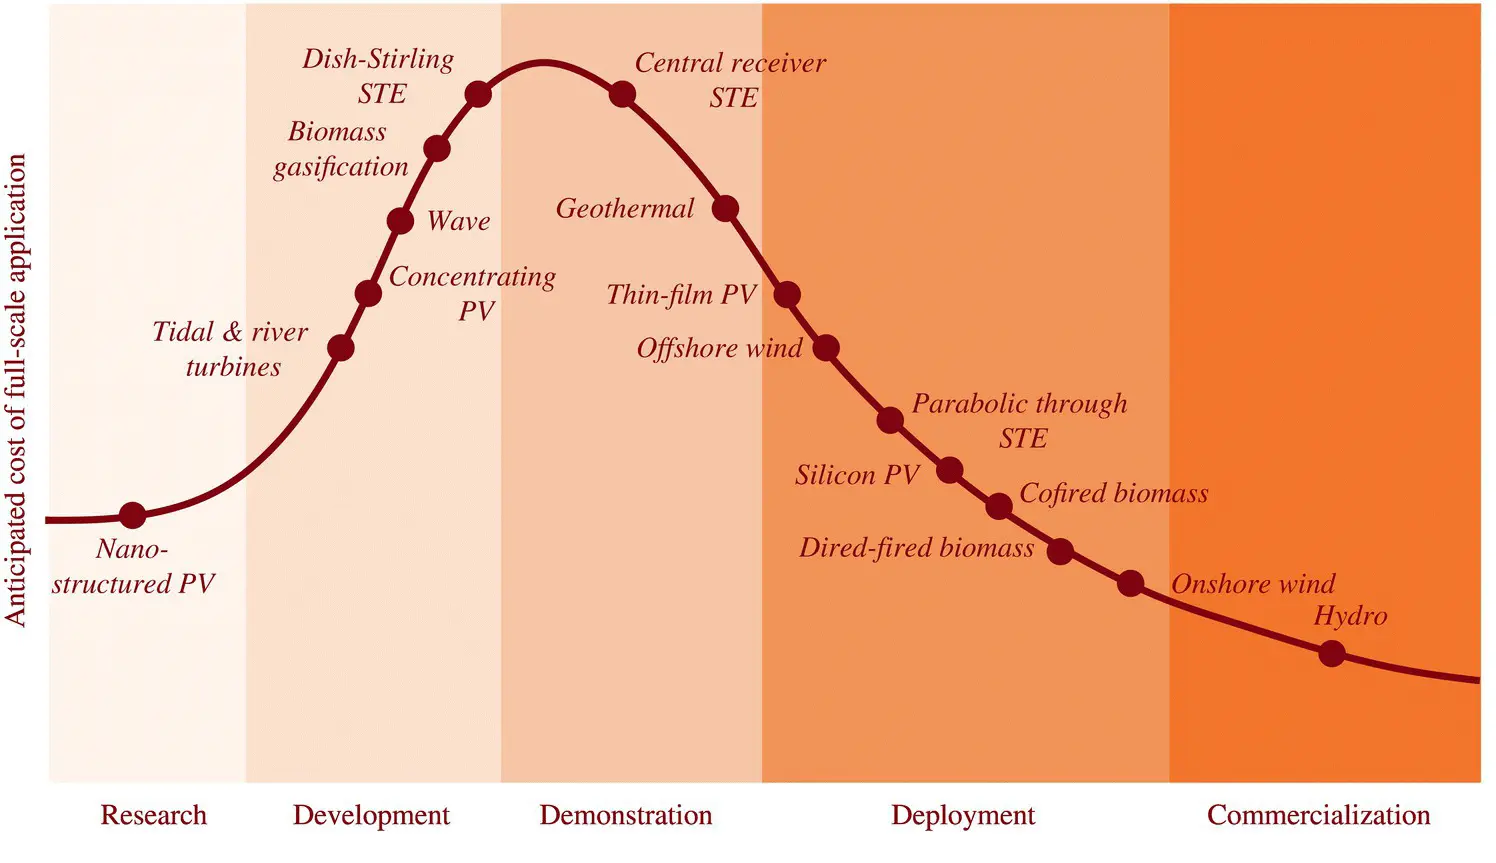
A number of renewable energy technologies are present at different stages of maturity, which affects its odds of achieving commercialization, its cost of implementation, or – in the case of many mature technologies – its market cost and the level of subsidies needed to obtain market competitiveness with incumbent energy technologies as indicated in Figure 2.32. Hydropower and bioenergy are major sources of energy globally. Additional options, yet technically proven and available on commercial terms, still hold only a small percentage of their potential markets. Consequently, there are numerous chances to enhance performance and decrease costs [60–62].
2.4 Smart Grid Enable Renewables
Over the past decade, renewable energy technologies have moved into the mainstream of every technology. Annual capacity of RES has been added to 100 GW and exceeds all traditional energies since 2011. Figure 2.33illustrates a general taxonomy of possible RES challenges. These challenges could be classified into: technical, financial and societal.
Интервал:
Закладка:
Похожие книги на «Smart Grid and Enabling Technologies»
Представляем Вашему вниманию похожие книги на «Smart Grid and Enabling Technologies» списком для выбора. Мы отобрали схожую по названию и смыслу литературу в надежде предоставить читателям больше вариантов отыскать новые, интересные, ещё непрочитанные произведения.


Обсуждение, отзывы о книге «Smart Grid and Enabling Technologies» и просто собственные мнения читателей. Оставьте ваши комментарии, напишите, что Вы думаете о произведении, его смысле или главных героях. Укажите что конкретно понравилось, а что нет, и почему Вы так считаете.