Giuseppe A. Paleologo - Advanced Portfolio Management
Здесь есть возможность читать онлайн «Giuseppe A. Paleologo - Advanced Portfolio Management» — ознакомительный отрывок электронной книги совершенно бесплатно, а после прочтения отрывка купить полную версию. В некоторых случаях можно слушать аудио, скачать через торрент в формате fb2 и присутствует краткое содержание. Жанр: unrecognised, на английском языке. Описание произведения, (предисловие) а так же отзывы посетителей доступны на портале библиотеки ЛибКат.
- Название:Advanced Portfolio Management
- Автор:
- Жанр:
- Год:неизвестен
- ISBN:нет данных
- Рейтинг книги:3 / 5. Голосов: 1
-
Избранное:Добавить в избранное
- Отзывы:
-
Ваша оценка:
Advanced Portfolio Management: краткое содержание, описание и аннотация
Предлагаем к чтению аннотацию, описание, краткое содержание или предисловие (зависит от того, что написал сам автор книги «Advanced Portfolio Management»). Если вы не нашли необходимую информацию о книге — напишите в комментариях, мы постараемся отыскать её.
Advanced Portfolio Management
You will learn how to:
Separate stock-specific return drivers from the investment environment’s return drivers Understand current investment themes Size your cash positions based on Your investment ideas Understand your performance Measure and decompose risk Hedge the risk you don’t want Use diversification to your advantage Manage losses and control tail risk Set your leverage Author Giuseppe A. Paleologo has consulted, collaborated, taught, and drank strong wine with some of the best stock-pickers in the world; he has traded tens of billions of dollars hedging and optimizing their books and has helped them navigate through big drawdowns and even bigger recoveries. Whether or not you have access to risk models or advanced mathematical background, you will benefit from the techniques and the insights contained in the book—and won't find them covered anywhere else.
Advanced Portfolio Management — читать онлайн ознакомительный отрывок
Ниже представлен текст книги, разбитый по страницам. Система сохранения места последней прочитанной страницы, позволяет с удобством читать онлайн бесплатно книгу «Advanced Portfolio Management», без необходимости каждый раз заново искать на чём Вы остановились. Поставьте закладку, и сможете в любой момент перейти на страницу, на которой закончили чтение.
Интервал:
Закладка:
Now, we can apply this formula to Synchrony. The volatility of the market term is

The idiosyncratic volatility is
The dollar variance of Synchrony returns is  and finally the volatility is $162K.
I hope I bored you with this calculation, because it is boring . But this is a back-of-the-envelope calculation that helps for many tasks. For example: you can pull SYF and SP500 returns from a website or Bloomberg for the past year, estimate their vols, then perform a quick regression in Excel to estimate the beta of SYF to SP500 and then use the same calculation above to derive the idiosyncratic vol (do it!). Yes, there is a Bloomberg function for that (BETA  GO
GO  ), and yes, even Yahoo Finance reports the trailing 3-year beta. But suppose that you don't want a three-year beta. Or suppose that you don't want to include a certain date range in SYF returns, for example, the day of an idiosyncratic event that resulted in a one-off large return, and is not representative of the future volatility of the stock. There are many valid reasons for wanting to customize the estimation of vols and betas. Once you have understood the principle, you are the master of your own destiny, even if you pull the data from a commercial model.
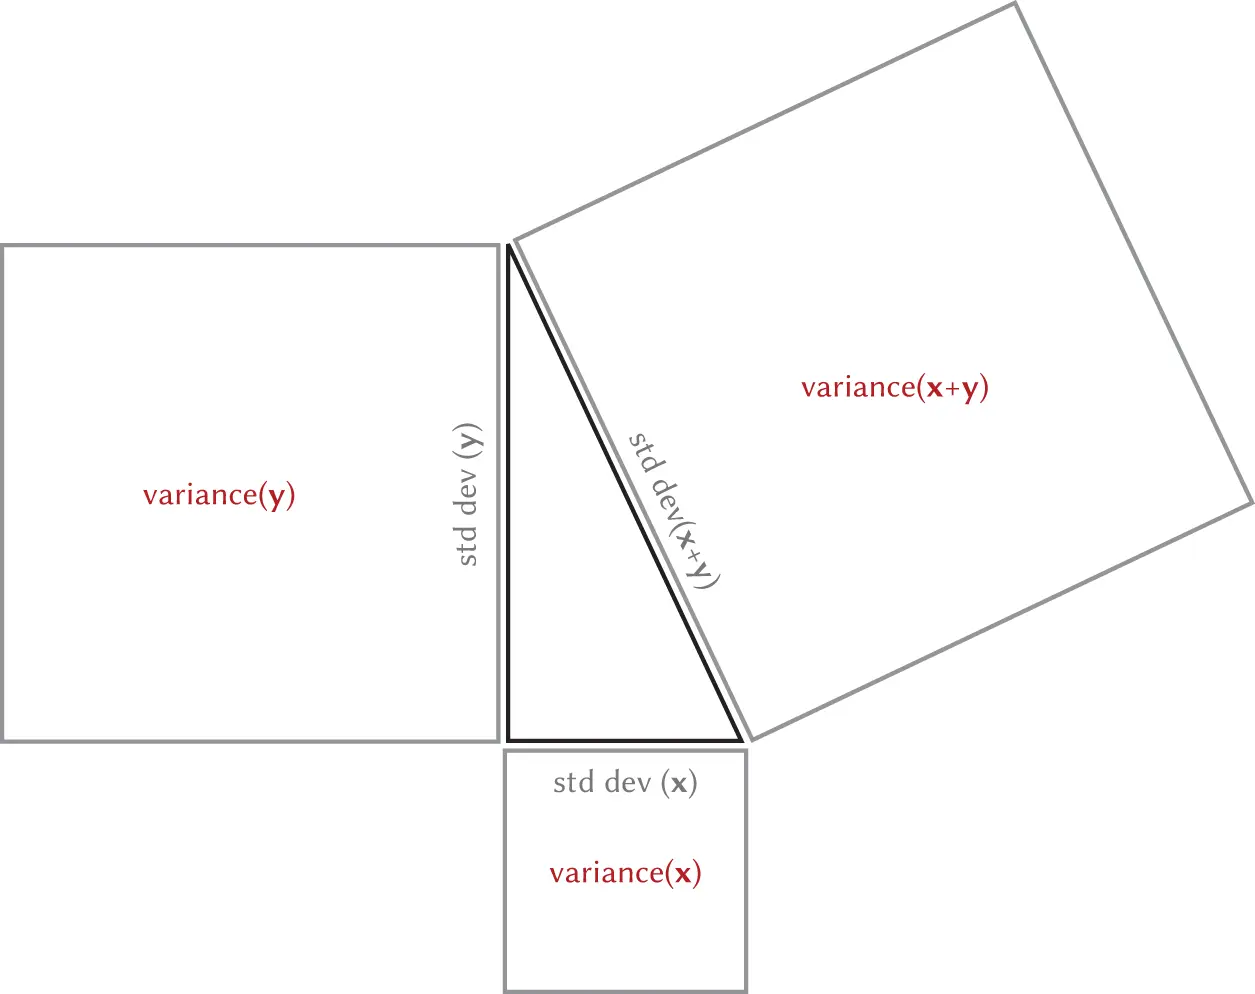
Figure 3.3 The variance of the sum of two independent random variables is equal to the sum to the variances of the two random variables. You can interpret the standard deviations as sides of a right triangle.
Now that we have understood the risk decomposition of a single stock into market and idio, let's extend to a whole portfolio. The parameters from the risk model and the portfolio are in Table 3.5.
Table 3.5 Synchrony, Wal-Mart and SP500 risk parameters, together with holdings for each asset.
| Field | SYF | WMT | SPY |
|---|---|---|---|
| Beta | 1.2 | 0.7 | 1 |
| Daily Market Vol (%) | 1.4 | ||
| Daily Idio Vol (%) | 1.2 | 0.5 | 0.0 |
| Net Market Value | $10M | $5M | $10M |
The daily PnL (“Profit and Loss”) of the portfolio is defined as the sum of the holdings times their respective returns:

Now, we can use Equation (3.1)to replace returns with their components, and rearrange the terms:
(3.2) 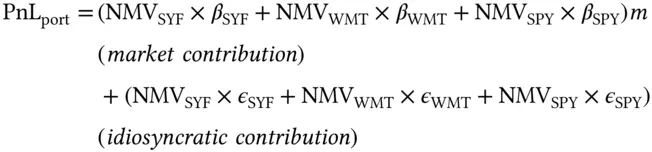
The performance of the portfolio can be split into the contribution of two terms: a market term and an idiosyncratic one. This is a simple example of performance attribution .
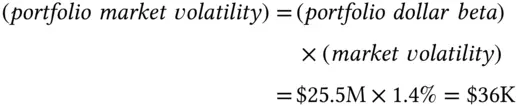
The beta of the portfolio is  . The important thing to notice is that the beta of the portfolio is the sum of the betas of the individual holdings. This overall portfolio beta is expressed in dollars, and usually is called the dollar beta of the portfolio. This dollar beta, multiplied by the market return
  , gives the contribution of the market to the portfolio PnL. The daily volatility of the portfolio deriving from the market is
An alternative way to quote the beta of a portfolio is in percentage beta , which is defined as the dollar beta divided by the net market value of the portfolio. If we netted out our positions, the percentage beta is the dollar beta per unit of dollar held long in the portfolio. 6 In our case the percentage beta is 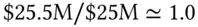 .
.
The other term is the idiosyncratic PnL. The volatility of the idiosyncratic PnL of the portfolio is the sum of three terms. As in the case of two variables, the variance of the sum is the sum of the variances:
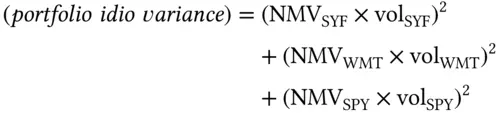
And the volatility is

Finally, the variance of the portfolio is the sum of the variances, because idio and market returns are independent of each other. The volatility is the square root:

The procedure is described in Procedure Box 3.1. Let us go through another simple example.
Procedure 3.1Compute the volatility of a portfolio.
1 Compute the dollar betas for the individual positions;
2 Compute the dollar portfolio beta as the sum of the individual betas;
3 Compute the market component of the volatility as (portfolio beta) (market volatility);
4 Compute the dollar idio volatility as the square root of the sum of the squared dollar volatilities.
Table 3.6 Portfolio example, with increasing number of stocks. Each stock has unit beta. The daily stocks' idio vol and market vol are both 1%.
| # Stocks | Idio Vol ($) | Market Vol ($) | Idio Var (% tot) |
|---|---|---|---|
| 1 | 1M | 1M | 50 |
| 10 | 316K | 1M | 9.09 |
| 100 | 100K | 1M | 0.99 |
| 1000 | 31.6K | 1M | 0.01 |
Say that you consider four long-only portfolios, each one with $100M of market value. The first one has one stock, the second one has ten stocks, the third has 100 stocks, the fourth one has 1000 stocks. Each stock has beta 1, and a daily idio vol of 1%. The market also has a daily vol of 1%. These are made-up numbers of course, but they simplify the calculation, and real portfolios are not that far from these values. What are the idio and market components of these portfolios? Table 3.6has the numbers. 7
Читать дальшеИнтервал:
Закладка:
Похожие книги на «Advanced Portfolio Management»
Представляем Вашему вниманию похожие книги на «Advanced Portfolio Management» списком для выбора. Мы отобрали схожую по названию и смыслу литературу в надежде предоставить читателям больше вариантов отыскать новые, интересные, ещё непрочитанные произведения.


Обсуждение, отзывы о книге «Advanced Portfolio Management» и просто собственные мнения читателей. Оставьте ваши комментарии, напишите, что Вы думаете о произведении, его смысле или главных героях. Укажите что конкретно понравилось, а что нет, и почему Вы так считаете.