Ian Smith - Smith's Elements of Soil Mechanics
Здесь есть возможность читать онлайн «Ian Smith - Smith's Elements of Soil Mechanics» — ознакомительный отрывок электронной книги совершенно бесплатно, а после прочтения отрывка купить полную версию. В некоторых случаях можно слушать аудио, скачать через торрент в формате fb2 и присутствует краткое содержание. Жанр: unrecognised, на английском языке. Описание произведения, (предисловие) а так же отзывы посетителей доступны на портале библиотеки ЛибКат.

- Название:Smith's Elements of Soil Mechanics
- Автор:
- Жанр:
- Год:неизвестен
- ISBN:нет данных
- Рейтинг книги:5 / 5. Голосов: 1
-
Избранное:Добавить в избранное
- Отзывы:
-
Ваша оценка:
Smith's Elements of Soil Mechanics: краткое содержание, описание и аннотация
Предлагаем к чтению аннотацию, описание, краткое содержание или предисловие (зависит от того, что написал сам автор книги «Smith's Elements of Soil Mechanics»). Если вы не нашли необходимую информацию о книге — напишите в комментариях, мы постараемся отыскать её.
Smith's Elements of Soil Mechanics — читать онлайн ознакомительный отрывок
Ниже представлен текст книги, разбитый по страницам. Система сохранения места последней прочитанной страницы, позволяет с удобством читать онлайн бесплатно книгу «Smith's Elements of Soil Mechanics», без необходимости каждый раз заново искать на чём Вы остановились. Поставьте закладку, и сможете в любой момент перейти на страницу, на которой закончили чтение.
Интервал:
Закладка:
Two versions of the plasticity chart exist (BS 5930 and BS EN ISO 14688‐2) and either may be used: the former in the UK, the latter elsewhere in Europe. The boundaries between the degrees of plasticity are the same from both charts. It is only the symbols used to indicate the plasticity group that differ between the two.
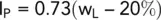
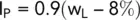
The U‐line in Fig. 1.9b indicates the approximate upper limit for natural soils and has equation,
Example 1.5 Soil classification (i)
1 Classify the soil of Example 1.2whose particle size distribution curve is shown in Fig. 1.3.
2 If the soil tested in Example 1.3experienced 100% passing the 63 mm sieve, 96% passing the 2 mm sieve and 85% passing the 63 μm sieve, classify the soil.
Solution:
1 Using Tables 1.2and 1.3, the soil is classified a medium graded gravelly SAND.
2 The PSD may be plotted to visualise the results (see spreadsheet example_1.3_and_1.5b.xls) or the classification may be made by reviewing the data directly:Particle fractions:Gravel: 100 – 96 = 4%Sand: 96 − 85 = 11%Silt: 85 − 58 * = 27%Clay: 58*%
* In the pipette analysis, 68.7% of the sample was found to be clay. That test was performed only on the fraction passing the 63 μm sieve. To establish the percentage of clay in the whole soil, we must consider the proportion passing the 63 μm sieve as a fraction of the whole soil sample.

Based on the percentages of each fraction, the soil may therefore be classified as a slightly sandy, silty CLAY.
Since it is a clay, it must also be classified in terms of its plasticity. To do this we use the results of Example 1.4together with the plasticity chart ( Fig. 1.9). It is seen that the soil therefore is a slightly sandy, silty CLAY of high plasticity.
Example 1.6Soil classification (ii)
A set of particle size distribution analyses on three soils, A, B and C, gave the following results:
| Percentage passing | |||
| Sieve size (mm) | Soil A | Soil B | Soil C |
| 20 | 90 | – | – |
| 10 | 56 | – | – |
| 6.3 | 47 | – | – |
| 2 | 43 | – | – |
| 0.6 | 39 | 93 | – |
| 0.425 | – | 78 | – |
| 0.300 | 28 | 16 | – |
| 0.212 | – | 5 | – |
| 0.150 | – | – | 100 |
| 0.063 | 5 | 2 | 92 |
Soil C : Since more than 10% passed the 63 μm sieve, a pipette analysis was performed. The results were:
| Particle size (mm) | Percentage passing |
| 0.04 | 79 |
| 0.02 | 62 |
| 0.006 | 47 |
| 0.002 | 40 |
Soil C was found to have a liquid limit of 48% and a plastic limit of 29%. Plot the particle size distribution curves and classify each soil.
Solution:
The particle size distribution curves for the three soils are shown in Fig. 1.10. The curves can be used to obtain the following particle sizes for soils A and B.
| Soil | D 10(mm) | D 30(mm) | D 60(mm) |
| A | 0.1 | 0.31 | 12.0 |
| B | 0.26 | 0.36 | 0.38 |
Soil A : From the grading curve it is seen that this soil consists of 57% gravel and 43% sand and is therefore predominantly gravel. The curve has a horizontal portion indicating that the soil has only a small percentage of soil particles within this range. It is therefore gap graded. Also, C u= 120.
The soil is a gap graded sandy GRAVEL.
Soil B : From the grading curve, it is immediately seen that this soil is a sand with most of its particles about the same size. Also, C u= 1.5.
The soil is a uniformly graded SAND.
Soil C : From the grading curve, it is seen that the soil is a mixture of 10% sand, 50% silt and 40% clay so it is a slightly sandy, very clayey SILT. The liquid limit of the soil = 48% and the plasticity index, (w L− w P) = 19%. Using Fig. 1.9, it is seen that the soil is a silt with the group symbol MI (BS 5930) or SiM (BS EN ISO 14688‐2).
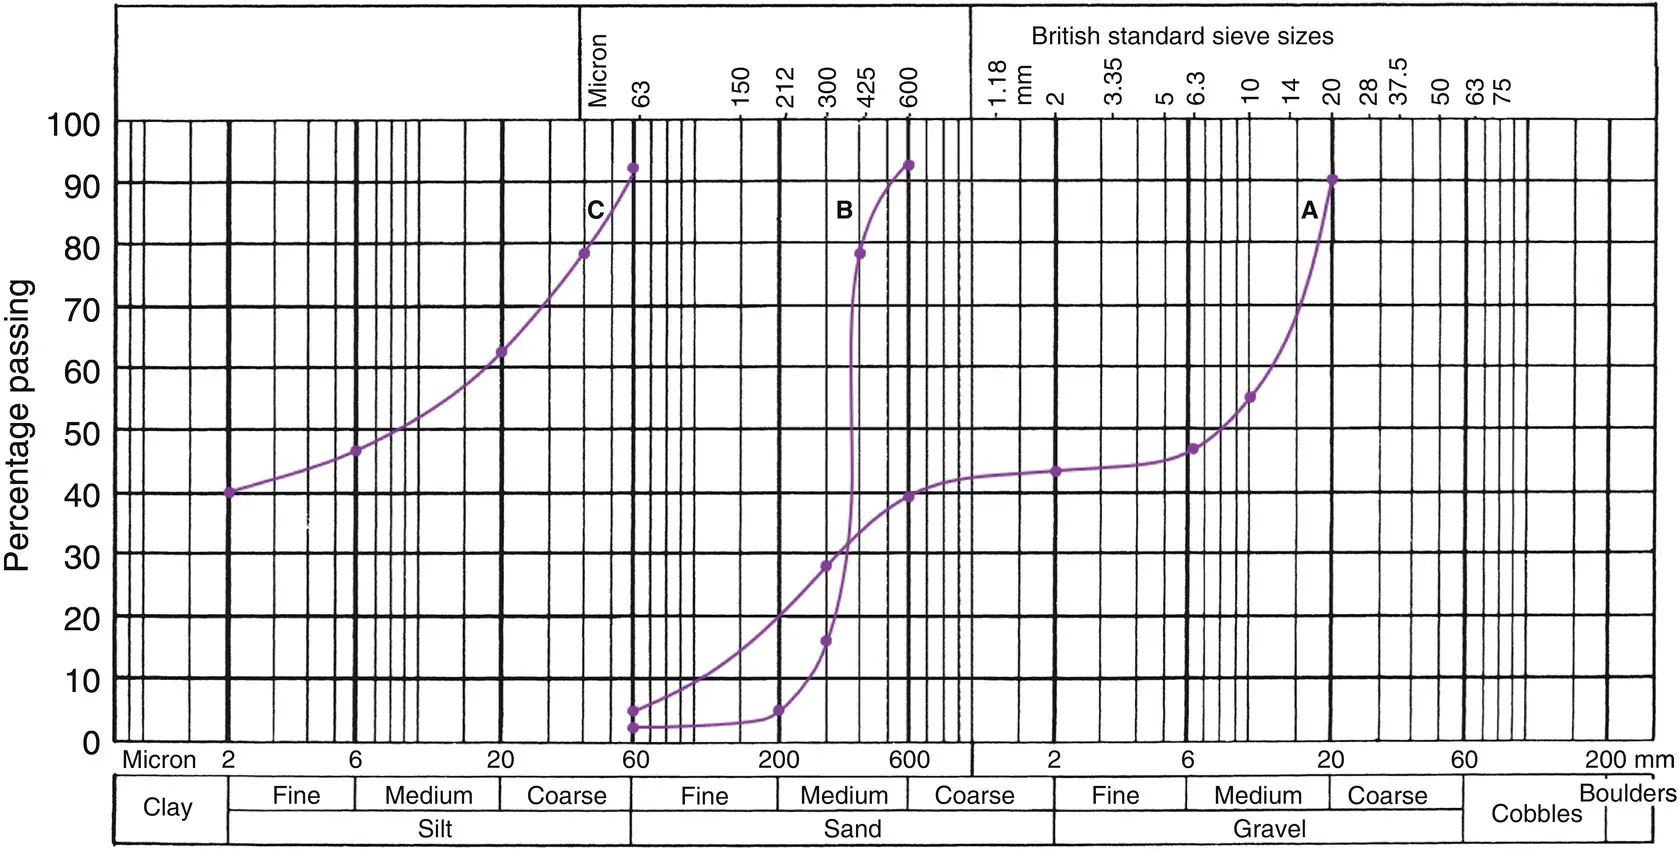
Fig. 1.10 Example 1.6.
1.6.2 Description of soils
Classifying and describing a soil are two operations, which are not necessarily the same. An operator who has not even visited the site from which a soil came can classify the soil from the information obtained from grading and plasticity tests carried out on disturbed samples. Such tests are necessary if the soil is being considered as a possible construction material and the information obtained from them must be included in any description of the soil.
Further information regarding the colour of a soil, the texture of its particles, etc., can be obtained in the laboratory from disturbed soil samples but a full description of a soil must include its in situ , as well as its laboratory, characteristics. Some of this latter information can be found in the laboratory from undisturbed samples of the soil collected for other purposes, such as strength or permeability tests, but usually not until after the tests have taken place and the samples can then be split open for proper examination. Other relevant information such as bedding details, gravel particle shapes (e.g. angular, rounded, elongated), clay consistency (e.g. soft, firm, stiff) and site observations can also be included in the soil's description.
1.7 Soil properties
From the foregoing it is seen that soil consists of a mass of solid particles separated by spaces, or voids . A cross‐section through a granular soil may have an appearance similar to that shown in Fig. 1.11a.
In order to study the properties of such a soil mass, it is advantageous to adopt an idealised form of the diagram as shown in Fig. 1.11b. The soil mass has a total volume V and a volume of solid particles equal to V s. The volume of the voids, V vis obviously equal to V − V s.
1.7.1 Void ratio and porosity
From a study of Fig. 1.11, the following may be defined:
Void ratio, e
(1.7) 
Porosity, n
(1.8) 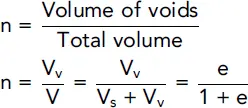
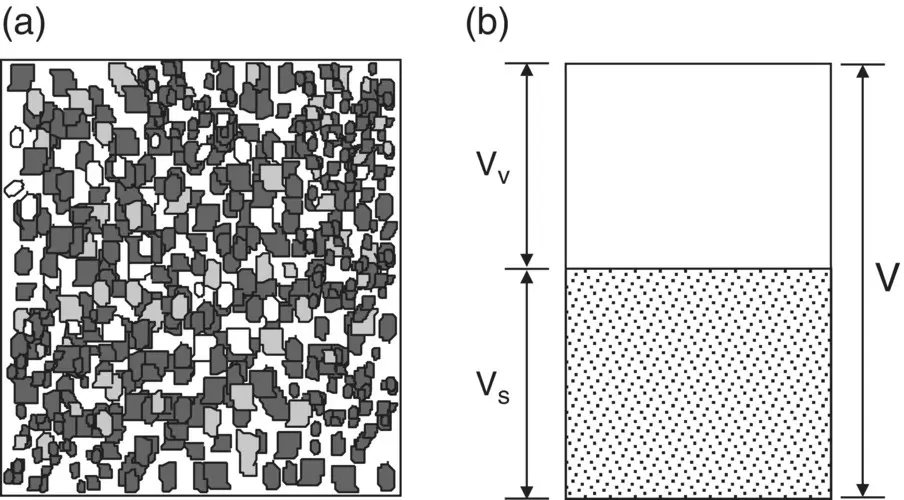
Fig. 1.11 Cross‐section through a granular soil. (a) Actual form. (b) Idealised form.
Читать дальшеИнтервал:
Закладка:
Похожие книги на «Smith's Elements of Soil Mechanics»
Представляем Вашему вниманию похожие книги на «Smith's Elements of Soil Mechanics» списком для выбора. Мы отобрали схожую по названию и смыслу литературу в надежде предоставить читателям больше вариантов отыскать новые, интересные, ещё непрочитанные произведения.


Обсуждение, отзывы о книге «Smith's Elements of Soil Mechanics» и просто собственные мнения читателей. Оставьте ваши комментарии, напишите, что Вы думаете о произведении, его смысле или главных героях. Укажите что конкретно понравилось, а что нет, и почему Вы так считаете.