Genetic Analysis of Complex Disease
Здесь есть возможность читать онлайн «Genetic Analysis of Complex Disease» — ознакомительный отрывок электронной книги совершенно бесплатно, а после прочтения отрывка купить полную версию. В некоторых случаях можно слушать аудио, скачать через торрент в формате fb2 и присутствует краткое содержание. Жанр: unrecognised, на английском языке. Описание произведения, (предисловие) а так же отзывы посетителей доступны на портале библиотеки ЛибКат.
- Название:Genetic Analysis of Complex Disease
- Автор:
- Жанр:
- Год:неизвестен
- ISBN:нет данных
- Рейтинг книги:4 / 5. Голосов: 1
-
Избранное:Добавить в избранное
- Отзывы:
-
Ваша оценка:
Genetic Analysis of Complex Disease: краткое содержание, описание и аннотация
Предлагаем к чтению аннотацию, описание, краткое содержание или предисловие (зависит от того, что написал сам автор книги «Genetic Analysis of Complex Disease»). Если вы не нашли необходимую информацию о книге — напишите в комментариях, мы постараемся отыскать её.
An up-to-date and complete treatment of the strategies, designs and analysis methods for studying complex genetic disease in human beings Genetic Analysis of Complex Diseases
Genetic Analysis of Complex Diseases
Genetic Analysis of Complex Diseases
Genetic Analysis of Complex Disease — читать онлайн ознакомительный отрывок
Ниже представлен текст книги, разбитый по страницам. Система сохранения места последней прочитанной страницы, позволяет с удобством читать онлайн бесплатно книгу «Genetic Analysis of Complex Disease», без необходимости каждый раз заново искать на чём Вы остановились. Поставьте закладку, и сможете в любой момент перейти на страницу, на которой закончили чтение.
Интервал:
Закладка:
One can also use recurrence risks to make a rough estimate of the number of genes involved in a disorder if one assumes a particular inheritance pattern. For example, the λ sibling= 100 for autism spectrum disorder (Bolton et al. 1994; Bailey et al. 1995). It is clear that autism spectrum disorder does not follow a Mendelian mode of inheritance, and in fact, is more consistent with an epistatic interaction of multiple loci (Jorde et al. 1991). If we assume that there are four genes contributing an equal, additive effect to the genetic susceptibility, the λ siblingfor each locus would be 25 (25 + 25 + 25 + 25 =100). If there are four genes contributing an equal multiplicative effect, the λ siblingfor each locus would be approximately 3.2 (3.2 * 3.2 * 3.2 * 3.2 = 105). This type of information may be useful in determining the power to detect loci in a data set. That is, with a sample size of 100 sibpairs, the power to detect linkage at a locus with λ sibling= 3.0 is about 85%, and the power to detect linkage at a locus with λ sibling= 25 would be approaching 100% (Risch 1990b, figure 1). Thus, in this particular case, under either the additive or multiplicative model, one should have sufficient power to detect loci with 100 sibpairs.
Heritability
Heritability ( h 2) is a measurement of the genetic contribution to a trait, or how much of the trait variability can be attributed to genetics rather than other causes. Heritability may be defined in the broad or narrow sense. Heritability in the broad sense is defined as follows:
(3.4) 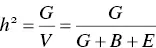
where V is the total phenotypic variance, G is the genetic variance of the phenotype, B is the within family variance of the phenotype, and E is the random environmental variance of the phenotype. The genetic variance can be further broken down into the additive (effects of alleles at a particular locus), dominance (effects of allelic interactions at a particular locus), and epistatic variance (effects of allelic interactions from multiple loci). Heritability in the narrow sense is a measure of the additive genetic variation in a trait. Estimates of heritability will vary between 0 and 1, with h 2= 0 representing traits that are entirely controlled by nongenetic factors and h 2= 1 representing traits that are entirely controlled by genetic factors. Here we will focus simpler methods of calculating heritability in the context of analyses defined in previous sections of the current chapter.
The correlation coefficient that one obtains from plotting a trait value in one relative versus the trait value in another relative may be used to calculate heritability in the narrow sense, provided that the relatives under consideration are not full siblings:
(3.5) 
For example, if one plots the age of onset for a condition in a proband versus the age of onset in an affected parent, the square of the correlation coefficient ( r 2, or the slope of the line) obtained from the plot would be divided by 1/2, the number of alleles shared identical by descent (IBD) for a parent–child pair. This particular approach to calculating heritability does not represent heritability in the narrow sense when considering full siblings because one has to take into account dominance variance, as well. See Hartl and Clark (1997) for a more thorough discussion of using the covariance between two relatives to estimate heritability.
Rice and colleagues (1997) extended this approach to incorporate correlations from multiple relative pairs ( r sib, siblings; r p‐o, parent–offspring; r sp, spousal):
(3.6) 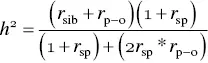
Example Using Correlation Coefficients to Calculate Heritability
In a large study that assessed the genetic contribution to normal variation of pulmonary function, Wilk and colleagues (2000) calculated familial correlations for spouses, parent–offspring pairs, and siblings from 455 Caucasian families for forced expiratory volume (FEV1; a measure of airflow), forced vital capacity (FVC; a measure of lung volume), and the ratio of FEV/FVC and using formula 3.6, obtained heritability estimates for the three traits ( Table 3.4).
Correlations for a trait among monozygotic and dizygotic twins can also be used to calculate heritability:
(3.7) 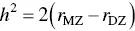
Heritability estimates can be quite useful for data mining of a phenotype prior to initiating a genome scan. For example, if several phenotypic measures for a condition have been collected, heritability estimates may provide guidance as to which of those measures will be most useful for genetic analysis. That is, those phenotypes with the highest h 2values should be prioritized for analysis.
Table 3.4 Familial correlation and heritability estimates of pulmonary function.
Source: Wilk et al. (2000, table II).
| Trait | r sib | r p‐o | r sp | h 2 |
|---|---|---|---|---|
| FEV1 | 0.259 | 0.239 | −0.067 | 0.52 |
| FVC | 0.257 | 0.242 | −0.135 | 0.54 |
| FEV1/FVC ratio | 0.27 | 0.19 | 0.071 | 0.45 |
With the advent of Genome‐Wide Association Study (GWAS), the concept of “missing heritability” was coined to describe the difference between the estimated heritability and the amount of heritability attributable to genome‐wide significant loci detected through GWAS (Manolio et al. 2009). From this observation, methods to estimate heritability using genome‐wide SNP data emerged such that one could calculate the “SNP heritability,” suggesting that additional SNP loci not meeting genome‐wide significance contribute to the missing heritability. The most widely used of these methods include genomic‐relatedness‐matrix restricted maximum likelihood (GREML) (Yang et al. 2010) which is implemented in GCTA software (Yang et al. 2011), linkage disequilibrium score regression (LDSR) (Bulik‐Sullivan et al. 2015), and LD‐adjusted kinships (LDAK) (Speed et al. 2017). A good review of genome‐wide heritability estimation can be found in Hall and Bush (2016).
Segregation Analysis
Segregation analysis is a modeling tool that is used to examine the patterns of disease in families and determine if the patterns are indicative of traditional genetic inheritance models (such as autosomal dominant, autosomal recessive, and polygenic) or are more consistent with nongenetic (environmental) models (Elston 1981; Morton 1982; Lalouel 1984). The likelihood of the data to fit a particular inheritance model is computed. By comparing the likelihood of several models, one can determine which model provides the “best fit” to the data. Segregation analysis does not prove that a particular inheritance model is correct but will determine if the data are consistent with that inheritance model.
The advantage of segregation analysis is that it can provide an inheritance model and parameters that may be used in parametric linkage analysis. However, generally segregation analysis can only model 1–2 loci, which may not be very useful for most complex diseases. That is, if none of the inheritance models examined in the segregation analysis can adequately accommodate the complexities of the underlying inheritance model of the disorder, even the “best‐fitting” model will not provide much information.
Читать дальшеИнтервал:
Закладка:
Похожие книги на «Genetic Analysis of Complex Disease»
Представляем Вашему вниманию похожие книги на «Genetic Analysis of Complex Disease» списком для выбора. Мы отобрали схожую по названию и смыслу литературу в надежде предоставить читателям больше вариантов отыскать новые, интересные, ещё непрочитанные произведения.


Обсуждение, отзывы о книге «Genetic Analysis of Complex Disease» и просто собственные мнения читателей. Оставьте ваши комментарии, напишите, что Вы думаете о произведении, его смысле или главных героях. Укажите что конкретно понравилось, а что нет, и почему Вы так считаете.