Machine Learning Techniques and Analytics for Cloud Security
Здесь есть возможность читать онлайн «Machine Learning Techniques and Analytics for Cloud Security» — ознакомительный отрывок электронной книги совершенно бесплатно, а после прочтения отрывка купить полную версию. В некоторых случаях можно слушать аудио, скачать через торрент в формате fb2 и присутствует краткое содержание. Жанр: unrecognised, на английском языке. Описание произведения, (предисловие) а так же отзывы посетителей доступны на портале библиотеки ЛибКат.

- Название:Machine Learning Techniques and Analytics for Cloud Security
- Автор:
- Жанр:
- Год:неизвестен
- ISBN:нет данных
- Рейтинг книги:3 / 5. Голосов: 1
-
Избранное:Добавить в избранное
- Отзывы:
-
Ваша оценка:
Machine Learning Techniques and Analytics for Cloud Security: краткое содержание, описание и аннотация
Предлагаем к чтению аннотацию, описание, краткое содержание или предисловие (зависит от того, что написал сам автор книги «Machine Learning Techniques and Analytics for Cloud Security»). Если вы не нашли необходимую информацию о книге — напишите в комментариях, мы постараемся отыскать её.
This book covers new methods, surveys, case studies, and policy with almost all machine learning techniques and analytics for cloud security solutions
Audience The aim of Machine Learning Techniques and Analytics for Cloud Security
Machine Learning Techniques and Analytics for Cloud Security — читать онлайн ознакомительный отрывок
Ниже представлен текст книги, разбитый по страницам. Система сохранения места последней прочитанной страницы, позволяет с удобством читать онлайн бесплатно книгу «Machine Learning Techniques and Analytics for Cloud Security», без необходимости каждый раз заново искать на чём Вы остановились. Поставьте закладку, и сможете в любой момент перейти на страницу, на которой закончили чтение.
Интервал:
Закладка:
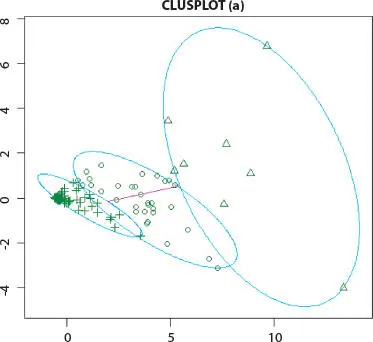
Figure 2.2 K-means cluster analysis of Influenza A (H1N1) non-infected human.
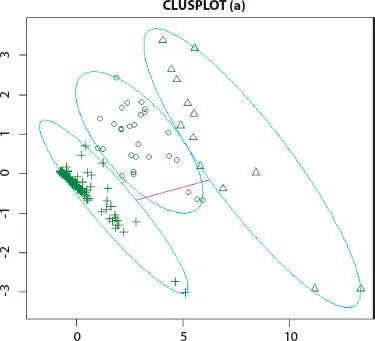
Figure 2.3K-means cluster analysis of Influenza A (H1N1) infected human.
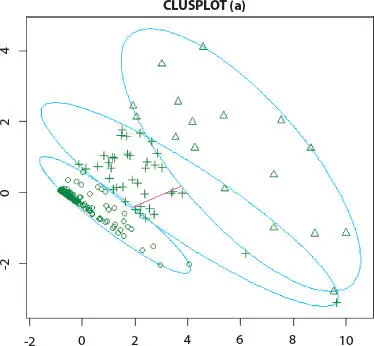
Figure 2.4K-means cluster analysis of Influenza A (H1N1) infected human.
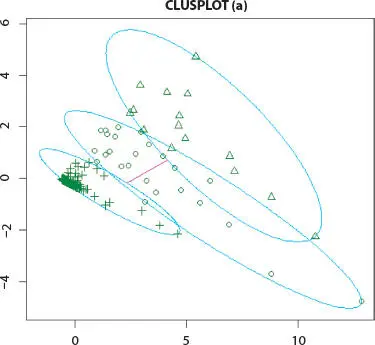
Figure 2.5 K-means cluster analysis of Influenza A (H1N1) infected human.
2.3.3 Validation of Results
2.3.3.1 T-Test (Statistical Validation)
The t-test statistical validation has been applied for comparing the means of two samples (infected and normal), even if they have different number of glycans. The following steps are used to solve t-test validation:
a) List H1N1 infected datasets for sample 1.
b) List normal dataset for sample 2.
c) Record the number replicates (in the data set, n = 3) for sample (The number of replicates for sample1, i.e., n1 is 3, the number of replicates for sample2, i.e., n2 is 3).
d) Compute the mean of both n1 and n2 (x1’, x2’). [mean = total/n]
e) Compute the standard deviation (σ) for each sample (σ1, σ2). Where, σ2 = ∑d2/(n − 1)
f) Compute the variance that is the difference between the two means . Where
g) Compute σb (square root of ).
h) Compute the p value as follows:
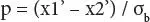

Figure 2.6 Hierarchical cluster analysis of Influenza A (H1N1) infected human.
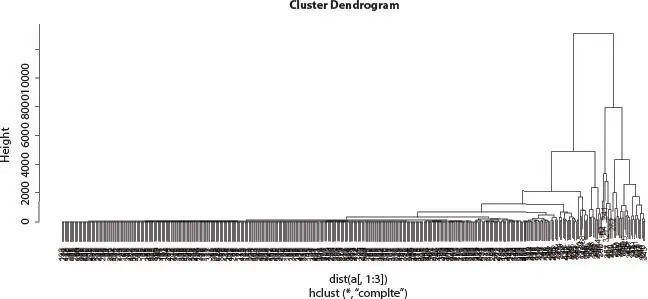
Figure 2.7Hierarchical cluster analysis of Influenza A (H1N1) infected human.
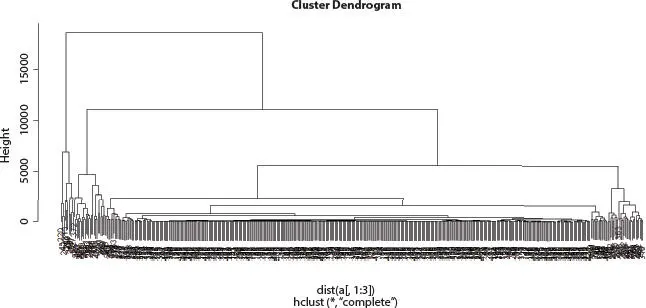
Figure 2.8 Hierarchical cluster analysis of Influenza A (H1N1) infected human.
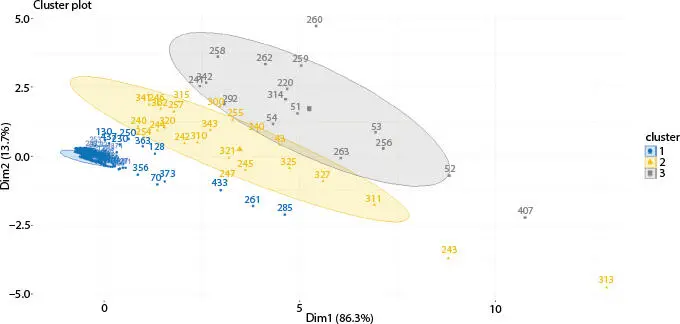
Figure 2.9 Fuzzy c-means cluster analysis of Influenza A (H1N1) infected human.
2.3.3.2 Statistical Validation
In this article, on both datasets, k-means algorithm has been applied where k value is 3. Secondly, on the same datasets, hierarchical algorithm has been applied. At last, on the same datasets, fuzzy c-means algorithm has been applied where cluster number is 3. Total numbers of glycans are 442 that are present in all datasets. On host cell surfaces, these 442 glycans are displayed and act as sensory receptors that basically identify the glycoproteins of the viral surface. Consider an example where these 442 glycan structures concluded by sialic acid a2, 3- or a2, 6-linked that is called N-acetyl neuraminic acid which acts as receptors for H1N1. The upper respiratory surface of human mainly displays sialylated glycan receptors that are executed with a2 to 6-linked sialic acid. Moreover, various types of glycan receptors are responsible to identify the hemagglutinin glycoprotein (HA) on the outermost part of influenza A viruses. This way, human can be infected and H1N1 viruses transmit via respiratory droplets in humans. Nineteen differentially expressed glycans are found out of 442 after applying three clustering algorithms. After that, t-test statistical validations are applied on the infected and non-infected (normal) datasets. In Table 2.1, nineteen differentially expressed glycans are found after t-test validation.
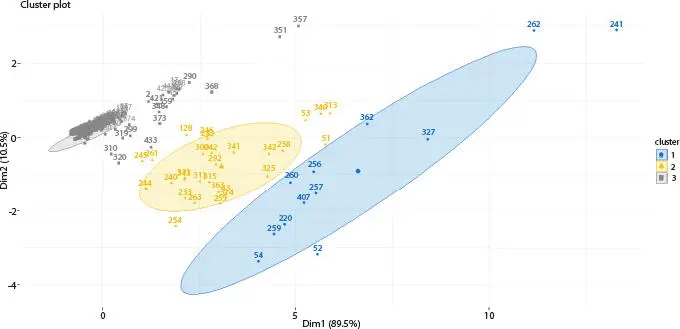
Figure 2.10Fuzzy c-means clustering algorithm of Influenza A (H1N1) infected human.
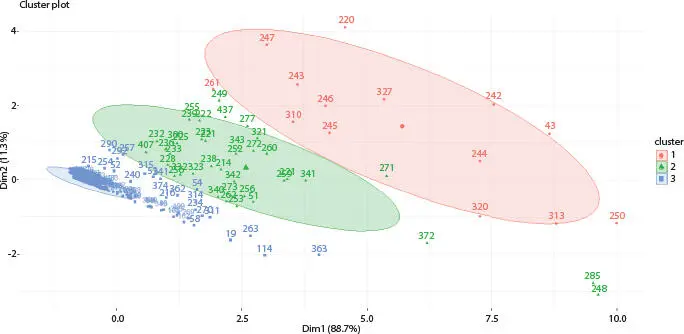
Figure 2.11 Fuzzy c-means clustering algorithm of Influenza A (H1N1) infected human.
After that, type-I and type-II errors are used for finding the accuracy and predicting the output between the actual and predicted values. Table 2.2 is represented as rows and columns where rows are experiment and columns are represented as gold set. The meaning of true positive (TP) is that the set of glycans are identified by our experiment as same as the result mentioned in the gold set. True negative (TN) means that the set of glycans are identified by our experiment not same as the result mentioned in the gold set. False negative (FN) means that the set of glycans are identified by our experiment which is missing in our experiment. False positive (FP) means that the set of glycans are identified by our experiment that positive but missing in the gold set. Type-I and Type-II errors are described in Figure 2.12.
Table 2.1Significant glycan list.
| Sr. no. | Structure |
|---|---|
| 1 | Neu5Aca2-3(6-O-Su)Galb1-4(Fuca1-3)GlcNAcb-Sp8 |
| 2 | Neu5Aca2-6Galb1-4GlcNAcb1-3Galb1-4(Fuca1-3)GlcNAcb1-3Galb1-4(Fuca1-3) GlcNAcb-Sp0 |
| 3 | Galb1-4GlcNAcb1-2Mana1-3(Neu5Aca2-6Galb1-4GlcNAcb1-2Mana1-6) Manb1-4GlcNAcb1-4GlcNAcb-Sp12 |
| 4 | GlcAb1-3GlcNAcb-Sp8 |
| 5 | Mana1-2Mana1-2Mana1-3(Mana1-2Mana1-6(Mana1-2Mana1-3)Mana1-6)Mana-Sp9 |
| 6 | GlcNAcb1-2Mana1-3(Galb1-4GlcNAcb1-2Mana1-6) Manb1-4GlcNAcb1-4GlcNAc-Sp12 |
| 7 | Galb1-4GlcNacb1-2(Galb1-4GlcNacb1-4)Mana1-3(Galb1-4GlcNacb1-2(Galb1-4GlcNacb1-6)Mana1-6)Manb1-4GlcNacb1-4GlcNacb-Sp21 |
| 8 | Galb1-3Galb1-4GlcNAcb-Sp8 |
| 9 | Galb1-3(Neu5Aca2-6)GalNAca-Sp14 |
| 10 | Neu5Aca2-6Galb1-4Glcb-Sp0 |
| 11 | Neu5Aca2-3Galb1-4GlcNAcb1-2Mana1-3(Neu5Aca2-3Galb1-4GlcNAcb1-2Mana1-6)Manb1-4GlcNAcb1-4GlcNAcb-Sp12 |
| 12 | Neu5Aca2-6Galb1-4GlcNAcb1-2Mana1-3(Neu5Aca2-3Galb1-4GlcNAcb1-2Mana1-6)Manb1-4GlcNAcb1-4GlcNAcb-Sp12 |
| 13 | Neu5Aca2-6GlcNAcb1-4GlcNAcb1-4GlcNAc-Sp21 |
| 14 | Neu5Aca2-3Galb1-4GlcNAcb-Sp8 |
| 15 | Neu5Aca2-6Galb1-4GlcNAcb-Sp0 |
| 16 | Neu5Gca2-3Galb1-4(Fuca1-3)GlcNAcb-Sp0 |
| 17 | Neu5Aca2-3Galb1-4GlcNAcb1-3Galb1-3GlcNAcb-Sp0 |
| 18 | Neu5Aca2-6Galb1-4GlcNAcb1-3Galb1-6GlcNAcb-Sp8 |
| 19 | Neu5Aca2-3Galb1-3GalNAcb1-4(Neu5Aca2-8Neu5Aca2-3)Galb1-4Glcb-Sp0 |
Table 2.2The tabular format has been created from the above diagram.
Читать дальшеИнтервал:
Закладка:
Похожие книги на «Machine Learning Techniques and Analytics for Cloud Security»
Представляем Вашему вниманию похожие книги на «Machine Learning Techniques and Analytics for Cloud Security» списком для выбора. Мы отобрали схожую по названию и смыслу литературу в надежде предоставить читателям больше вариантов отыскать новые, интересные, ещё непрочитанные произведения.


Обсуждение, отзывы о книге «Machine Learning Techniques and Analytics for Cloud Security» и просто собственные мнения читателей. Оставьте ваши комментарии, напишите, что Вы думаете о произведении, его смысле или главных героях. Укажите что конкретно понравилось, а что нет, и почему Вы так считаете.