Machine Learning Techniques and Analytics for Cloud Security
Здесь есть возможность читать онлайн «Machine Learning Techniques and Analytics for Cloud Security» — ознакомительный отрывок электронной книги совершенно бесплатно, а после прочтения отрывка купить полную версию. В некоторых случаях можно слушать аудио, скачать через торрент в формате fb2 и присутствует краткое содержание. Жанр: unrecognised, на английском языке. Описание произведения, (предисловие) а так же отзывы посетителей доступны на портале библиотеки ЛибКат.
- Название:Machine Learning Techniques and Analytics for Cloud Security
- Автор:
- Жанр:
- Год:неизвестен
- ISBN:нет данных
- Рейтинг книги:3 / 5. Голосов: 1
-
Избранное:Добавить в избранное
- Отзывы:
-
Ваша оценка:
Machine Learning Techniques and Analytics for Cloud Security: краткое содержание, описание и аннотация
Предлагаем к чтению аннотацию, описание, краткое содержание или предисловие (зависит от того, что написал сам автор книги «Machine Learning Techniques and Analytics for Cloud Security»). Если вы не нашли необходимую информацию о книге — напишите в комментариях, мы постараемся отыскать её.
This book covers new methods, surveys, case studies, and policy with almost all machine learning techniques and analytics for cloud security solutions
Audience The aim of Machine Learning Techniques and Analytics for Cloud Security
Machine Learning Techniques and Analytics for Cloud Security — читать онлайн ознакомительный отрывок
Ниже представлен текст книги, разбитый по страницам. Система сохранения места последней прочитанной страницы, позволяет с удобством читать онлайн бесплатно книгу «Machine Learning Techniques and Analytics for Cloud Security», без необходимости каждый раз заново искать на чём Вы остановились. Поставьте закладку, и сможете в любой момент перейти на страницу, на которой закончили чтение.
Интервал:
Закладка:
In 2015, a framework has been proposed of the genetics of the new strain and recognized its nearest relatives in swine using a cluster analysis approach like as the PCA and k-means clustering algorithm and suitable with a reassortment of Eurasian and North American swine viruses [5, 20]. Glycoproteins are the key elements of human pathogenic viruses and perform important roles in infection and immunity. The influenza A virus contains two surface glycoproteins which consist of hemagglutinin (HA) and neuraminidase (NA) that dominate the virion exterior and form antibodies. One major of the components of the outermost layer of viruses is glycans. The communication between the viral pathogens with pathogens’ hosts is affected by the glycans’ pattern and glycan-binding receptors. Due to the mass branching of carbohydrates, they are the complex bio-molecules, and in this process, various glycoproteins are used to recognize with human pathogens (virus). Infectious glycans can be either virus-encoded or can be host-derived that usually obtained by humoral immune responses (high) within the human body. HA and NA both are responsible for creating a connection with envelope glycoproteins of the influenza virus. When HA communicates with terminal sialyl residues of oligosaccharides that ensure the binding of the virion to the cell surface. To eliminate sialyl residues from oligosaccharides contained in cell and virus components, NA is also needed. It is a receptor-destroying enzyme that prevents aggregation of virus particles [7, 25].
In this paper, our goal is to identify differentially expressed glycan. The clustering algorithms have been applied to H1N1 infected human datasets and non-infected human data-set. After that, we compare infected with the non-infected dataset and identify differentially expressed glycan.
2.2 Proposed Methodology
Input:Let, the dataset Dconsists of “n” number of glycan with “m” number of parameter values like RFU (relative fluorescence units), STDEV (standard deviation), and SEM (squared error mean). Each glycan is a vector and is represented by g1, g2, g3, …, gi, …, gn. The dataset Dhas two states normal (represented by DN) and diseased or H1N1 infected state (represented by DI).
Output:Differentially expressed glycan identification G’
Step-1:Apply clustering algorithm “C” on normal (represented by DN) and diseased or H1N1 infected state (represented by DI).
Step-2:Result for normal state = 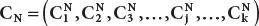 ; similarly, result for infected state =
 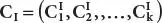 ; Here, clusters number is k.
Step-3:Find out the identical clusters or matched clusters between normal states to infected states.
Step-4:Perform cluster comparison and identify the differentially expressed glycan set Gthat has been changed quite significantly.

Step-5:For multiple glycan datasets D1, D2,…, Dt, the resultant glycan set will be represented as G’= G1∩ G2…∩ Gt; here, G1is the differentially expressed glycan set obtained in Step 4 for dataset D1.
The entire methodology has been depicted in Figure 2.1. In this paper, three clustering algorithms are used:
The first algorithm has been applied that is the k-means clustering and was proposed by scientist J.B. Macqueen. The actual idea behind this algorithm is to identify k centroids one for each cluster or group.
(1) At first, choose some points to represent initial cluster focal points.
(2) Secondly, assign each object to a cluster that has closed centroids.
(3) Thirdly, when all objects are assigned, then recalculate the position of the k centroids, and lastly, this process will be continued until the centroids no longer move and this basically produces separation of the objects into clusters from which the metric is to be minimized can be calculated [23].
The hierarchical clustering is the second algorithm. It groups similar objects into groups (cluster). In this algorithm, it basically treats every observation as an individual cluster. After that, it iterates the following steps continuously:
(1) At first, consider the two clusters or groups that are closest together.
(2) Then, combine the two most similar clusters. Until all the clusters are combined together, this process continues [24].
The fuzzy c-means clustering is the last and third algorithm. This algorithm’s concept is very like to the k-means clustering. The algorithm is as follows:
(1) At first, identify clusters number.
(2) Then, randomly assign coefficients to each data point for being in the clusters.
(3) Until the algorithm has converged, repeats (1) and (2) step:(i) Compute centroid of each cluster or group.(ii) For every data point, compute the coefficient of being in the cluster.
2.3 Result
Result section consists of description of datasets, analysis of results, and validation of results.
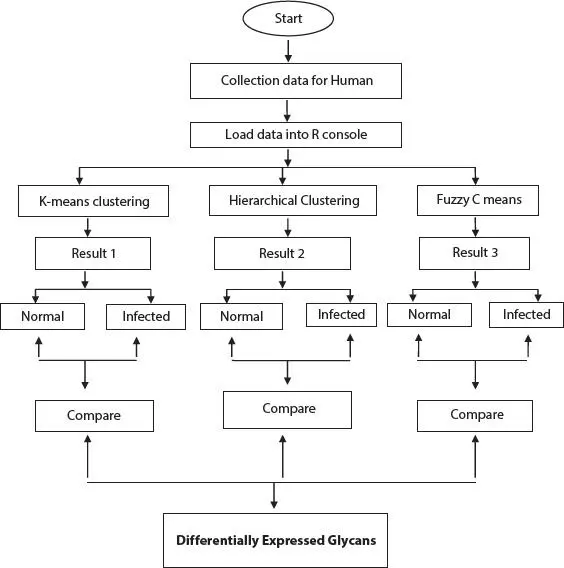
Figure 2.1 Flowchart of the methodology.
2.3.1 Description of Datasets
Influenza sequences (glycan dataset) are taken from the National Centre for Biotechnology Information. At first, to perform searching operation, Basic Local Alignment Search Tool (BLAST) has been applied on H1N1 infected human datasets of Influenza A/447/08 at Oklahoma, Influenza A/1138/08 at Oklahoma, and Influenza A/447/08 at Oklahoma and on non-infected normal human of Influenza A/California/04/2009-4C. The dataset of H1N1 contains glycan data in Oklahoma City and the dataset of normal human contains glycan data in California City. The dataset consists of 442 different glycans and list of linkers are sp0, sp8, sp9, sp12, etc. Individual columns of the dataset represent the glycan numbers, glycan structure, the RFU, the STDEV value, and the SEM.
2.3.2 Analysis of Result
In this paper, unsupervised machine learning method like as k-means, hierarchical, and fuzzy c-means algorithm are shown to prove excellent classification performance and have been successfully applied in data analysis of H1N1 infected and non-infected datasets. At first, k-means clustering algorithm are applied on H1N1 infected dataset Influenza A/447/08 at Oklahoma, Influenza A/1138/08 at Oklahoma, and Influenza A/447/08 at Oklahoma and on non-infected dataset Influenza A/California/04/2009-4C that are shown in Figures 2.2to 2.5. Same process will be repeated for hierarchical clustering algorithms that are shown in Figures 2.6to 2.8. Fuzzy c-means has applied on above-mentioned datasets that are shown in Figures 2.9to 2.11. After completing cluster analysis, we have collected those glycan structures where the value of RFU, STDEV, and SEM has been significantly changed from normal state to infected state.
Читать дальшеИнтервал:
Закладка:
Похожие книги на «Machine Learning Techniques and Analytics for Cloud Security»
Представляем Вашему вниманию похожие книги на «Machine Learning Techniques and Analytics for Cloud Security» списком для выбора. Мы отобрали схожую по названию и смыслу литературу в надежде предоставить читателям больше вариантов отыскать новые, интересные, ещё непрочитанные произведения.


Обсуждение, отзывы о книге «Machine Learning Techniques and Analytics for Cloud Security» и просто собственные мнения читателей. Оставьте ваши комментарии, напишите, что Вы думаете о произведении, его смысле или главных героях. Укажите что конкретно понравилось, а что нет, и почему Вы так считаете.