Distributed Acoustic Sensing in Geophysics
Здесь есть возможность читать онлайн «Distributed Acoustic Sensing in Geophysics» — ознакомительный отрывок электронной книги совершенно бесплатно, а после прочтения отрывка купить полную версию. В некоторых случаях можно слушать аудио, скачать через торрент в формате fb2 и присутствует краткое содержание. Жанр: unrecognised, на английском языке. Описание произведения, (предисловие) а так же отзывы посетителей доступны на портале библиотеки ЛибКат.
- Название:Distributed Acoustic Sensing in Geophysics
- Автор:
- Жанр:
- Год:неизвестен
- ISBN:нет данных
- Рейтинг книги:5 / 5. Голосов: 1
-
Избранное:Добавить в избранное
- Отзывы:
-
Ваша оценка:
Distributed Acoustic Sensing in Geophysics: краткое содержание, описание и аннотация
Предлагаем к чтению аннотацию, описание, краткое содержание или предисловие (зависит от того, что написал сам автор книги «Distributed Acoustic Sensing in Geophysics»). Если вы не нашли необходимую информацию о книге — напишите в комментариях, мы постараемся отыскать её.
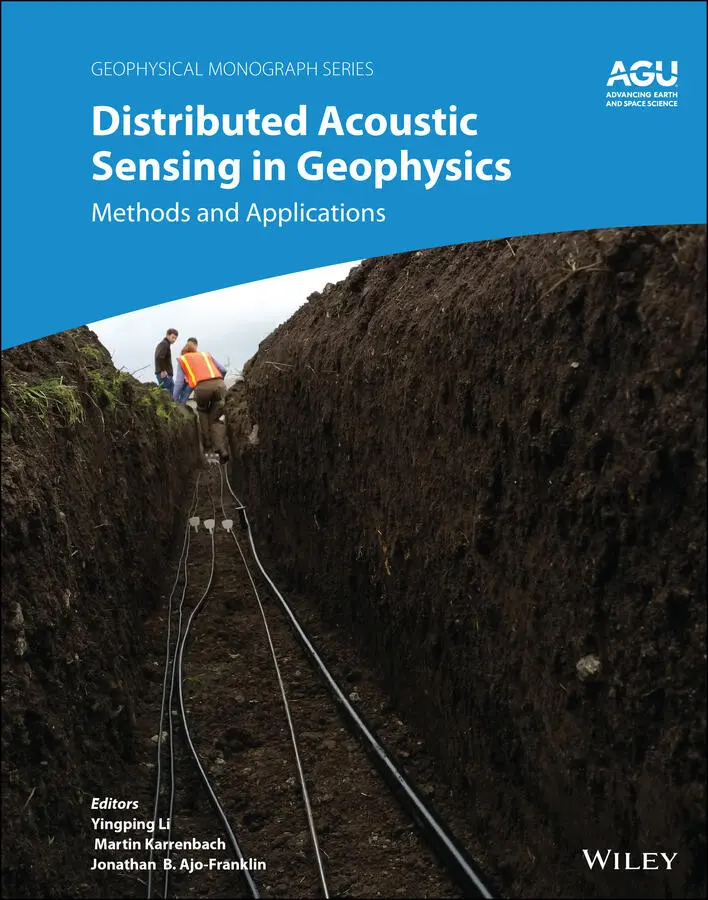
Distributed Acoustic Sensing in Geophysics Methods and Applications Distributed Acoustic Sensing (DAS) is a technology that records sound and vibration signals along a fiber optic cable. Its advantages of high resolution, continuous, and real-time measurements mean that DAS systems have been rapidly adopted for a range of applications, including hazard mitigation, energy industries, geohydrology, environmental monitoring, and civil engineering.
presents experiences from both industry and academia on using DAS in a range of geophysical applications. Volume highlights include: The American Geophysical Union promotes discovery in Earth and space science for the benefit of humanity. Its publications disseminate scientific knowledge and provide resources for researchers, students, and professionals.
Distributed Acoustic Sensing in Geophysics — читать онлайн ознакомительный отрывок
Ниже представлен текст книги, разбитый по страницам. Система сохранения места последней прочитанной страницы, позволяет с удобством читать онлайн бесплатно книгу «Distributed Acoustic Sensing in Geophysics», без необходимости каждый раз заново искать на чём Вы остановились. Поставьте закладку, и сможете в любой момент перейти на страницу, на которой закончили чтение.
Интервал:
Закладка:
9 Chapter 9Figure 9.1 We study surface waves (indicated by the red and blue bars) that ...Figure 9.2 Each polar plot shows the amplitude response of a measurement to ...Figure 9.3 The radius of each line represents the sensitivity of DAS with a ...Figure 9.4 The radius of each line represents the sensitivity of geophones (...Figure 9.5 The radius of each line represents the sensitivity of geophones (...Figure 9.6 The radius of each line represents the sensitivity of geophones (...Figure 9.7 The radius of each line represents the sensitivity of radial‐radi...Figure 9.8 We study the cross‐correlation response of two sensors at x 1= (−...Figure 9.9 Random synthetic point sources emitting Rayleigh waves were recor...Figure 9.10 A single long radial‐radial cross‐correlation of synthetic geoph...Figure 9.11 Random synthetic point sources emitting Love waves were recorded...Figure 9.12 (Left) A single long transverse‐transverse cross‐correlation of ...Figure 9.13 (Left) A virtual source is marked in yellow along one fiber line...Figure 9.14 (Left) A virtual source is marked in yellow along one fiber line...
10 Chapter 10Figure 10.1 (Left) Trace of the array overlaid to an aerial photo of the cam...Figure 10.2 Map of the southwest region of the Stanford campus. It shows the...Figure 10.3 Data recorded for all the Felt Lake events shown in the same ord...Figure 10.4 Results of template matching for data recorded by SFSO ((a), JRS...Figure 10.5 Results of template matching for data recorded by SFSO (a), JRSC...Figure 10.6 (Left) Virtual source gathers computed by cross‐coherency applie...Figure 10.7 Cross correlations between data recorded by Channel #27 and (lef...Figure 10.8 Cross correlations between data recorded by Channel #27 and (lef...Figure 10.9 (Left) Frequency spectra of the data recorded by the ODH 3.1 int...Figure 10.10 The Alum Rock event recorded by the ODH 3.1 interrogator. (Left...Figure 10.11 The Alum Rock event recorded by the ODH 4.0 interrogator. (Left...Figure 10.12 (Left) The different types of identified wave‐mode clusters ave...Figure 10.13 Array geometry automatically estimated by combining a convoluti...
11 Chapter 11Figure 11.1 The MIP‐3H well trajectory. The lateral landed and stayed in the...Figure 11.2 Logs acquired along the lateral of the MIP‐3H well. Curves from ...Figure 11.3 Rose diagrams of natural fractures (a) observed along the length...Figure 11.4 Vertical CT scan of the MIP‐3H pilot core (7508–7509 feet). Vert...Figure 11.5 The incident laser is backscattered in different wavelength Rama...Figure 11.6 (a) Upper plot shows the measured DTS from May 2016 to May 2018 ...Figure 11.7 The detrended DTS attribute is averaged to the stage scale. The ...Figure 11.8 Energy attribute for Stage 5 (a) and Stage 10 (b) stimulation fr...Figure 11.9 Microseismic events’ distribution is illustrated for Stages 7–28...Figure 11.10 (a) A cluster score is calculated for each cluster for every st...
12 Chapter 12Figure 12.1 Comparison of spectrum of microseismic synthetic data for an eve...Figure 12.2 Comparison of spectrum of microseismic synthetic data. (Left) Pa...Figure 12.3 Event location and receiver array used in this study. Length uni...Figure 12.4 Workflow to generate the DAS synthetic waveforms in this study....Figure 12.5 An example of a synthetic waveform of DAS. The event is located ...Figure 12.6 (Left) High‐level design of migration‐based event location algor...Figure 12.7 Event locations estimated by CMM for data set only at the horizo...Figure 12.8 Event locations (purple) estimated by CMM with automatic receive...Figure 12.9 An example of a flag for receiver selection and model time picks...Figure 12.10 Comparison of event location with and without automatic receive...
13 Chapter 13Figure 13.1 The CO2CRC Otway Project site location and satellite image. The ...Figure 13.2 Seismic fold (color bar) given by a combination of seven wells (...Figure 13.3 DAS‐SOV VSP records acquired for SOV1 [(a) and (b)] and SOV 2 [(...Figure 13.4 Amplitude spectrum for the constellation fiber (blue curve) and ...Figure 13.5 VSP to CDP transform for the constellation fiber (a) and the sta...Figure 13.6 Crossline from a conventional vibroseis‐geophone surface seismic...Figure 13.7 VSP acquired with DAS using large and small motors at SOV1 [(a) ...Figure 13.8 Results of VSP to CDP transform for test with sweeps from 0 to 8...
14 Chapter 15Figure 15.1 An aerial photograph showing location of the study site and tran...Figure 15.2 Data characteristics along the dark fiber array. (a) A 10 s reco...Figure 15.3 (a) Comparison of spectral amplitude of the distinct noise signa...Figure 15.4 Ambient noise processing flow for V srecovery at intermediate de...Figure 15.5 Comparison between a 30 minute single virtual shot gather and ph...Figure 15.6 Data sets and development of a reference V s( z ) model; panel (a) ...Figure 15.7 Results of multimodal inversion of the analyzed 1 km long virtua...
15 Chapter 16Figure 16.1 Map of the Garner Valley field site. The thick line is the layou...Figure 16.2 Subsurface geology at Garner Valley. (a) Shear‐wave velocity pro...Figure 16.3 (a) Mini‐Me structure. Locations of eccentric mass shaker and fo...Figure 16.4 Plots of 63 s of data for a colocated DAS channel 774 (top) and ...Figure 16.5 (a) Expanded plots of 13 s of data showing passing traffic for a...Figure 16.6 (a) Plot of 30 m of unfiltered DAS data. Channels are spaced 5 m...Figure 16.7 Plots (a) through (d) show source synchronous filtered MWCC DAS ...Figure 16.8 Dispersion curve results for the DAS and GVDA accelerometers num...Figure 16.9 Dispersion curve results from the DAS crosshatch line, as well a...Figure 16.10 (a) Modeled dispersion curve obtained by Stokoe et al. (2004) a...Figure 16.11 Dispersion curves obtained from the DAS long line active source...
16 Chapter 17Figure 17.1 Trend of collected journal and conference papers/abstracts relat...Figure 17.2 Histogram of papers presented at the SEG DAS workshops since 201...
Guide
1 Cover Page
2 Series Page
3 Title Page Geophysical Monograph 268
4 Copyright Page
5 List of Contributors
6 List of Reviewers
7 Preface
8 Table of Contents
9 Begin Reading
10 Index
11 Wiley End User License Agreement
Pages
1 ii
2 iii
3 iv
4 vii
5 viii
6 ix
7 x
8 xi
9 xiii
10 xv
11 xvi
12 1
13 3
14 4
15 5
16 6
17 7
18 8
19 9
20 10
21 11
22 12
23 13
24 14
25 15
26 16
27 17
28 18
29 19
30 20
31 21
32 22
33 23
34 24
35 25
36 26
37 27
38 28
39 29
40 30
41 31
42 32
43 33
44 34
45 35
46 36
47 37
48 38
49 39
50 40
51 41
52 42
53 43
54 44
55 45
56 46
57 47
58 48
59 49
60 50
61 51
62 52
63 53
64 54
65 55
66 57
67 58
68 59
69 60
70 61
71 62
72 63
73 64
74 65
75 67
76 68
77 69
78 70
79 71
80 72
81 73
82 74
83 75
84 76
85 77
86 78
87 79
88 81
89 82
90 83
91 84
92 85
93 86
94 87
95 88
96 89
97 90
98 91
99 93
100 94
101 95
102 96
103 97
104 98
105 99
106 101
107 102
108 103
109 104
110 105
111 106
112 107
113 108
114 109
115 110
116 111
117 113
118 114
Читать дальшеИнтервал:
Закладка:
Похожие книги на «Distributed Acoustic Sensing in Geophysics»
Представляем Вашему вниманию похожие книги на «Distributed Acoustic Sensing in Geophysics» списком для выбора. Мы отобрали схожую по названию и смыслу литературу в надежде предоставить читателям больше вариантов отыскать новые, интересные, ещё непрочитанные произведения.


Обсуждение, отзывы о книге «Distributed Acoustic Sensing in Geophysics» и просто собственные мнения читателей. Оставьте ваши комментарии, напишите, что Вы думаете о произведении, его смысле или главных героях. Укажите что конкретно понравилось, а что нет, и почему Вы так считаете.