Ahmed E. Yousef - Analytical Food Microbiology
Здесь есть возможность читать онлайн «Ahmed E. Yousef - Analytical Food Microbiology» — ознакомительный отрывок электронной книги совершенно бесплатно, а после прочтения отрывка купить полную версию. В некоторых случаях можно слушать аудио, скачать через торрент в формате fb2 и присутствует краткое содержание. Жанр: unrecognised, на английском языке. Описание произведения, (предисловие) а так же отзывы посетителей доступны на портале библиотеки ЛибКат.
- Название:Analytical Food Microbiology
- Автор:
- Жанр:
- Год:неизвестен
- ISBN:нет данных
- Рейтинг книги:3 / 5. Голосов: 1
-
Избранное:Добавить в избранное
- Отзывы:
-
Ваша оценка:
Analytical Food Microbiology: краткое содержание, описание и аннотация
Предлагаем к чтению аннотацию, описание, краткое содержание или предисловие (зависит от того, что написал сам автор книги «Analytical Food Microbiology»). Если вы не нашли необходимую информацию о книге — напишите в комментариях, мы постараемся отыскать её.
Reviews aseptic techniques, dilution, plating, streaking, isolation, and other basic microbiological procedures Introduces exercises and relevant microorganisms with pertinent background information and reference material Describes each technique using accessible explanatory text, detailed illustrations, and easy-to-follow flowcharts Employs a proven “building block” approach throughout, with each new chapter building upon skills from the previous chapter Provides useful appendices of microbiological media, recommended control organisms, available supplies and equipment, and laboratory exercise reports With methods drawn from the authors’ extensive experience in academic, regulatory, and industry laboratories,
is ideal for undergraduate and graduate students in food microbiology courses, as well as food processors and quality control personnel in laboratory training programs.
Analytical Food Microbiology — читать онлайн ознакомительный отрывок
Ниже представлен текст книги, разбитый по страницам. Система сохранения места последней прочитанной страницы, позволяет с удобством читать онлайн бесплатно книгу «Analytical Food Microbiology», без необходимости каждый раз заново искать на чём Вы остановились. Поставьте закладку, и сможете в любой момент перейти на страницу, на которой закончили чтение.
Интервал:
Закладка:
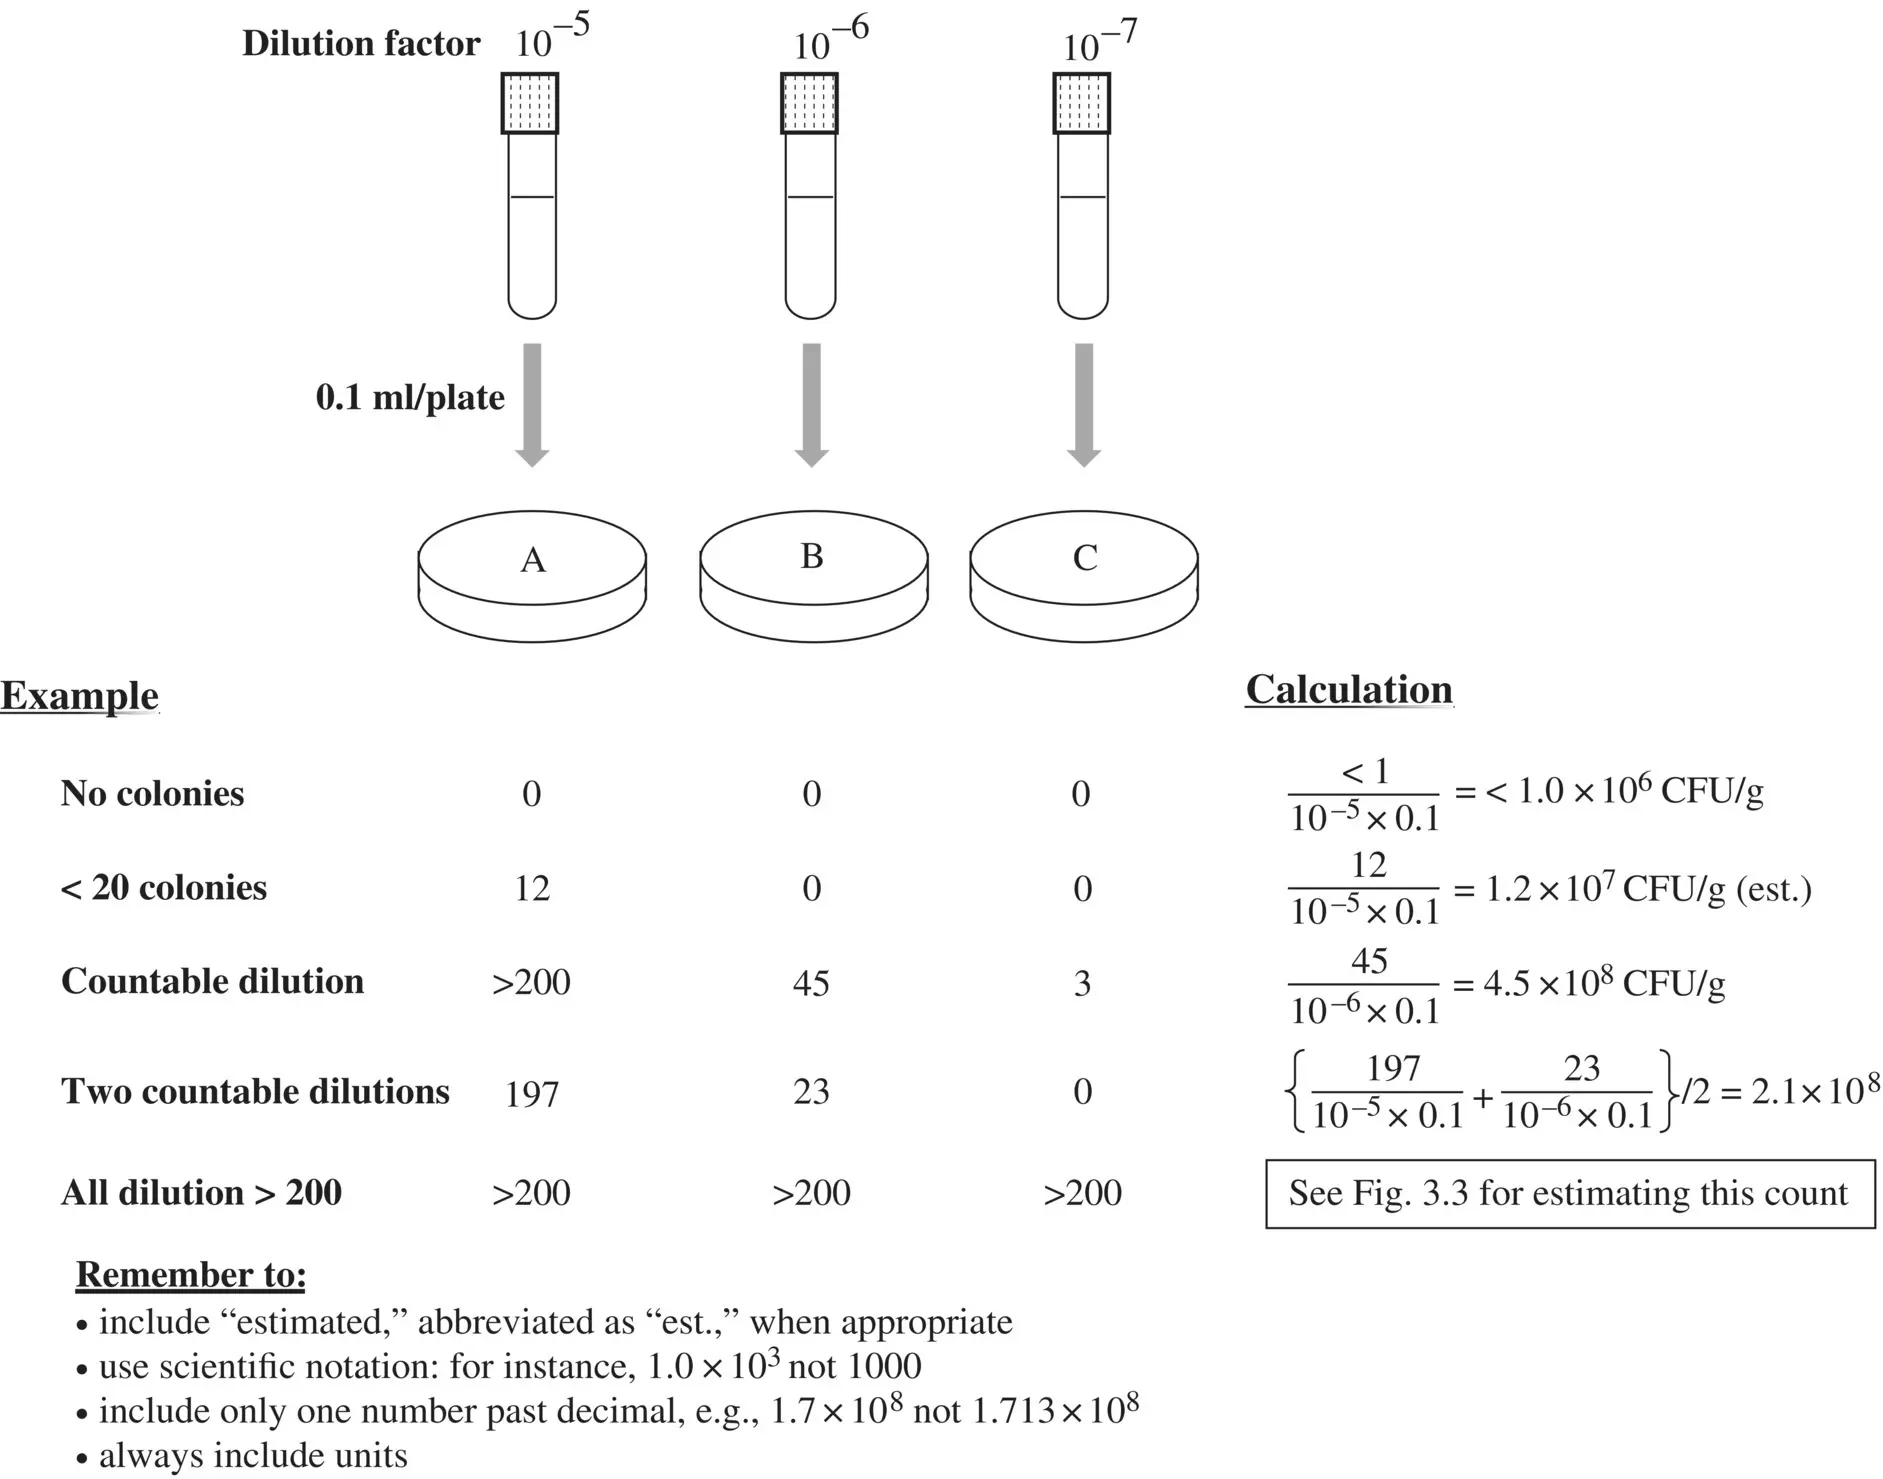
Figure 3.5 Applying colony and population counting rules.
Population Counting
After the colony count is determined, the analysist should be able to determine the concentration of a microorganism (or a microbial group) in the food. The concentration is often expressed as CFU per gram of that food. As inidicated before, this concentration will be referred to as “population count,” and it is governed by the following general equation:
(3.5) 
To calculate the denominator of equation 3.5, one should know the volume of diluted homogenate that has been plated and the concentration of food in that dilution.
(3.6) 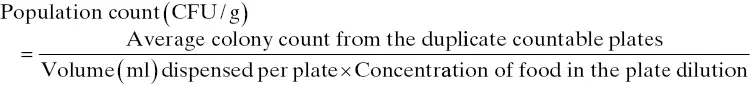
The volume dispensed in a Petri plate is commonly 0.1 ml for spread‐plating and 1.0 ml for pour‐plating, but volumes other than these can be used. The concentration of food in this diluted homogenate can be considered to equal the dilution factor. For example, if a food has been homogenized and diluted 1:100 (i.e., 10 –2dilution factor), this results in a concentration of 0.01 g of food per g (or mL) of diluted homogenate. Therefore, equation 3.6can be rewritten as follows:
(3.7) 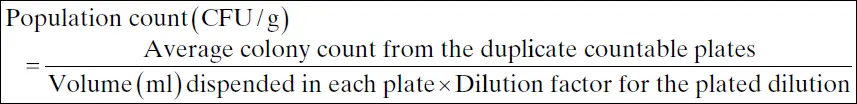
As previously stated, the density of food, diluted homogenate and diluent is approximated as 1 g/ml. Note that volume of sample dispensed is quantified in ml. If analysts have dispensed a volume measured in μl, this value will need to be adjusted to yield a correct population count.
Important Considerations
The following reminders should help in avoiding the common pitfalls encountered during enumeration of microorganisms in food:
Notice the difference in usage of “colony count” and “population count.”
When a specific microbial population is counted, the generic word “population” is replaced with a word or a phrase that describes the population. For example, in subsequent chapters, the “population count” is reported as aerobic mesophilic count, spore count, Enterobacteriaceae count, etc.
Population count should be presented in scientific notation, with two significant digits only reported (e.g., 3.7×10⁸).
In all examples presented, population count was based on unit food weight (g); however, samples of many liquid foods are measured volumetrically. In the latter case, population count is more accurately represented as CFU/ml.
MOST PROBABLE NUMBER METHOD
Principles
The most probable number () technique is useful for enumerating low levels of microorganisms (<10 3CFU/g) in water, milk, and foods whose structure interferes with accurate plate count methods. These small populations, generally, cannot be enumerated reliably with other techniques. The essence of the MPN technique is that the dilution of the sample into replicate tubes causes the viable population to decrease to a point where it becomes detectable in some of the diluted tubes (positive tubes) but not in the others (negative tubes). When positive and negative tubes in each dilution are counted, results can be used to estimate the population in the original sample. An estimate of population density in the original sample is based on probability formulas that take into account the following: number of dilutions included, the number of replicate tubes receiving each dilution, the number of positive tubes in each dilution, and the amount of original sample present in each dilution. Although equations are available for calculating MPN, tables that simplify the calculations are used ( Table 3.2).
To enumerate microbial population in a solid food using the MPN technique, the sample is homogenized and decimally diluted in an appropriate diluent as previously discussed. The number of dilutions prepared are often limited, with 2–4 dilutions typically prepared. Measured portions (e.g., 1 ml) of the food homogenate and its subsequent dilutions are transferred into replicate tubes (commonly 3) of a selective, differential, or selective‐differential broth medium depending on the target population. A larger number of replicate tubes (e.g.,5 tubes) may be used for increasing the proportion of the analytical sample subjected to analysis, thus improving the detection limit of the technique. The tubes are incubated at the appropriate temperature for the appropriate time, and the tubes are inspected for turbidity or for reactions specific to the microorganisms of interest. The results are used in calculating the MPN of the microorganism in g of food, as described later. An example of an MPN dilution and inoculation scheme is shown in Figure 3.6. To enumerate microbial population in a liquid food, the sample may be decimally diluted directly, an appropriate set of MPN tubes are prepared, and MPN/ml is calculated.
Scoring the Tubes and Calculating MPN
Following incubation, each tube is scored as positive or negative, depending on the target microorganism’s characteristic of interest to the analyst. The positive tubes per each dilution are tallied and the number of positives from consecutive dilutions are reported. The outcome is reported as a series of numbers separated with commas from least dilute to most dilute. Using the results presented in Figure 3.6, the MPN score would be 2, 2, 0.
TABLE 3.2 Most Probable Number (MPN) estimatesa based on the number of positive tubes resulting from three consecutive dilutions (three tubes each) representing 0.1 g, 0.01 g, and 0.001 g of food.
| Number of positive tubes | MPN/g | Number of positive tubes | MPN/g | Number of positive tubes | MPN/g | Number of positive tubes | MPN/g | ||||||||
|---|---|---|---|---|---|---|---|---|---|---|---|---|---|---|---|
| 0.1 g | 0.01 g | 0.001 g | 0.1 g | 0.01 g | 0.001 g | 0.1 g | 0.01 g | 0.001 g | 0.1 g | 0.01 g | 0.001 g | ||||
| 0 | 0 | 0 | <3 | 1 | 0 | 0 | 3.6 | 2 | 0 | 0 | 9.2 | 3 | 0 | 0 | 23 |
| 0 | 0 | 1 | 3 | 1 | 0 | 1 | 7.2 | 2 | 0 | 1 | 14 | 3 | 0 | 1 | 38 |
| 0 | 0 | 2 | 6 | 1 | 0 | 2 | 11 | 2 | 0 | 2 | 20 | 3 | 0 | 2 | 64 |
| 0 | 0 | 3 | 9 | 1 | 0 | 3 | 15 | 2 | 0 | 3 | 26 | 3 | 0 | 3 | 95 |
| 0 | 1 | 0 | 3 | 1 | 1 | 0 | 7.4 | 2 | 1 | 0 | 15 | 3 | 1 | 0 | 43 |
| 0 | 1 | 1 | 6.1 | 1 | 1 | 1 | 11 | 2 | 1 | 1 | 20 | 3 | 1 | 1 | 75 |
| 0 | 1 | 2 | 9.2 | 1 | 1 | 2 | 15 | 2 | 1 | 2 | 27 | 3 | 1 | 2 | 120 |
| 0 | 1 | 3 | 12 | 1 | 1 | 3 | 19 | 2 | 1 | 3 | 34 | 3 | 1 | 3 | 160 |
| 0 | 2 | 0 | 6.2 | 1 | 2 | 0 | 11 | 2 | 2 | 0 | 21 | 3 | 2 | 0 | 93 |
| 0 | 2 | 1 | 9.3 | 1 | 2 | 1 | 15 | 2 | 2 | 1 | 28 | 3 | 2 | 1 | 150 |
| 0 | 2 | 2 | 12 | 1 | 2 | 2 | 20 | 2 | 2 | 2 | 35 | 3 | 2 | 2 | 210 |
| 0 | 2 | 3 | 16 | 1 | 2 | 3 | 24 | 2 | 2 | 3 | 42 | 3 | 2 | 3 | 290 |
| 0 | 3 | 0 | 9.4 | 1 | 3 | 0 | 16 | 2 | 3 | 0 | 29 | 3 | 3 | 0 | 240 |
| 0 | 3 | 1 | 13 | 1 | 3 | 1 | 20 | 2 | 3 | 1 | 36 | 3 | 3 | 1 | 460 |
| 0 | 3 | 2 | 16 | 1 | 3 | 2 | 24 | 2 | 3 | 2 | 44 | 3 | 3 | 2 | 1100 |
| 0 | 3 | 3 | 19 | 1 | 3 | 3 | 29 | 2 | 3 | 3 | 53 | 3 | 3 | 3 | > 1100 |
aConfidence intervals are not included to simplify the table (FDA Bacteriological Analytical Manual and other sources).
Читать дальшеИнтервал:
Закладка:
Похожие книги на «Analytical Food Microbiology»
Представляем Вашему вниманию похожие книги на «Analytical Food Microbiology» списком для выбора. Мы отобрали схожую по названию и смыслу литературу в надежде предоставить читателям больше вариантов отыскать новые, интересные, ещё непрочитанные произведения.


Обсуждение, отзывы о книге «Analytical Food Microbiology» и просто собственные мнения читателей. Оставьте ваши комментарии, напишите, что Вы думаете о произведении, его смысле или главных героях. Укажите что конкретно понравилось, а что нет, и почему Вы так считаете.