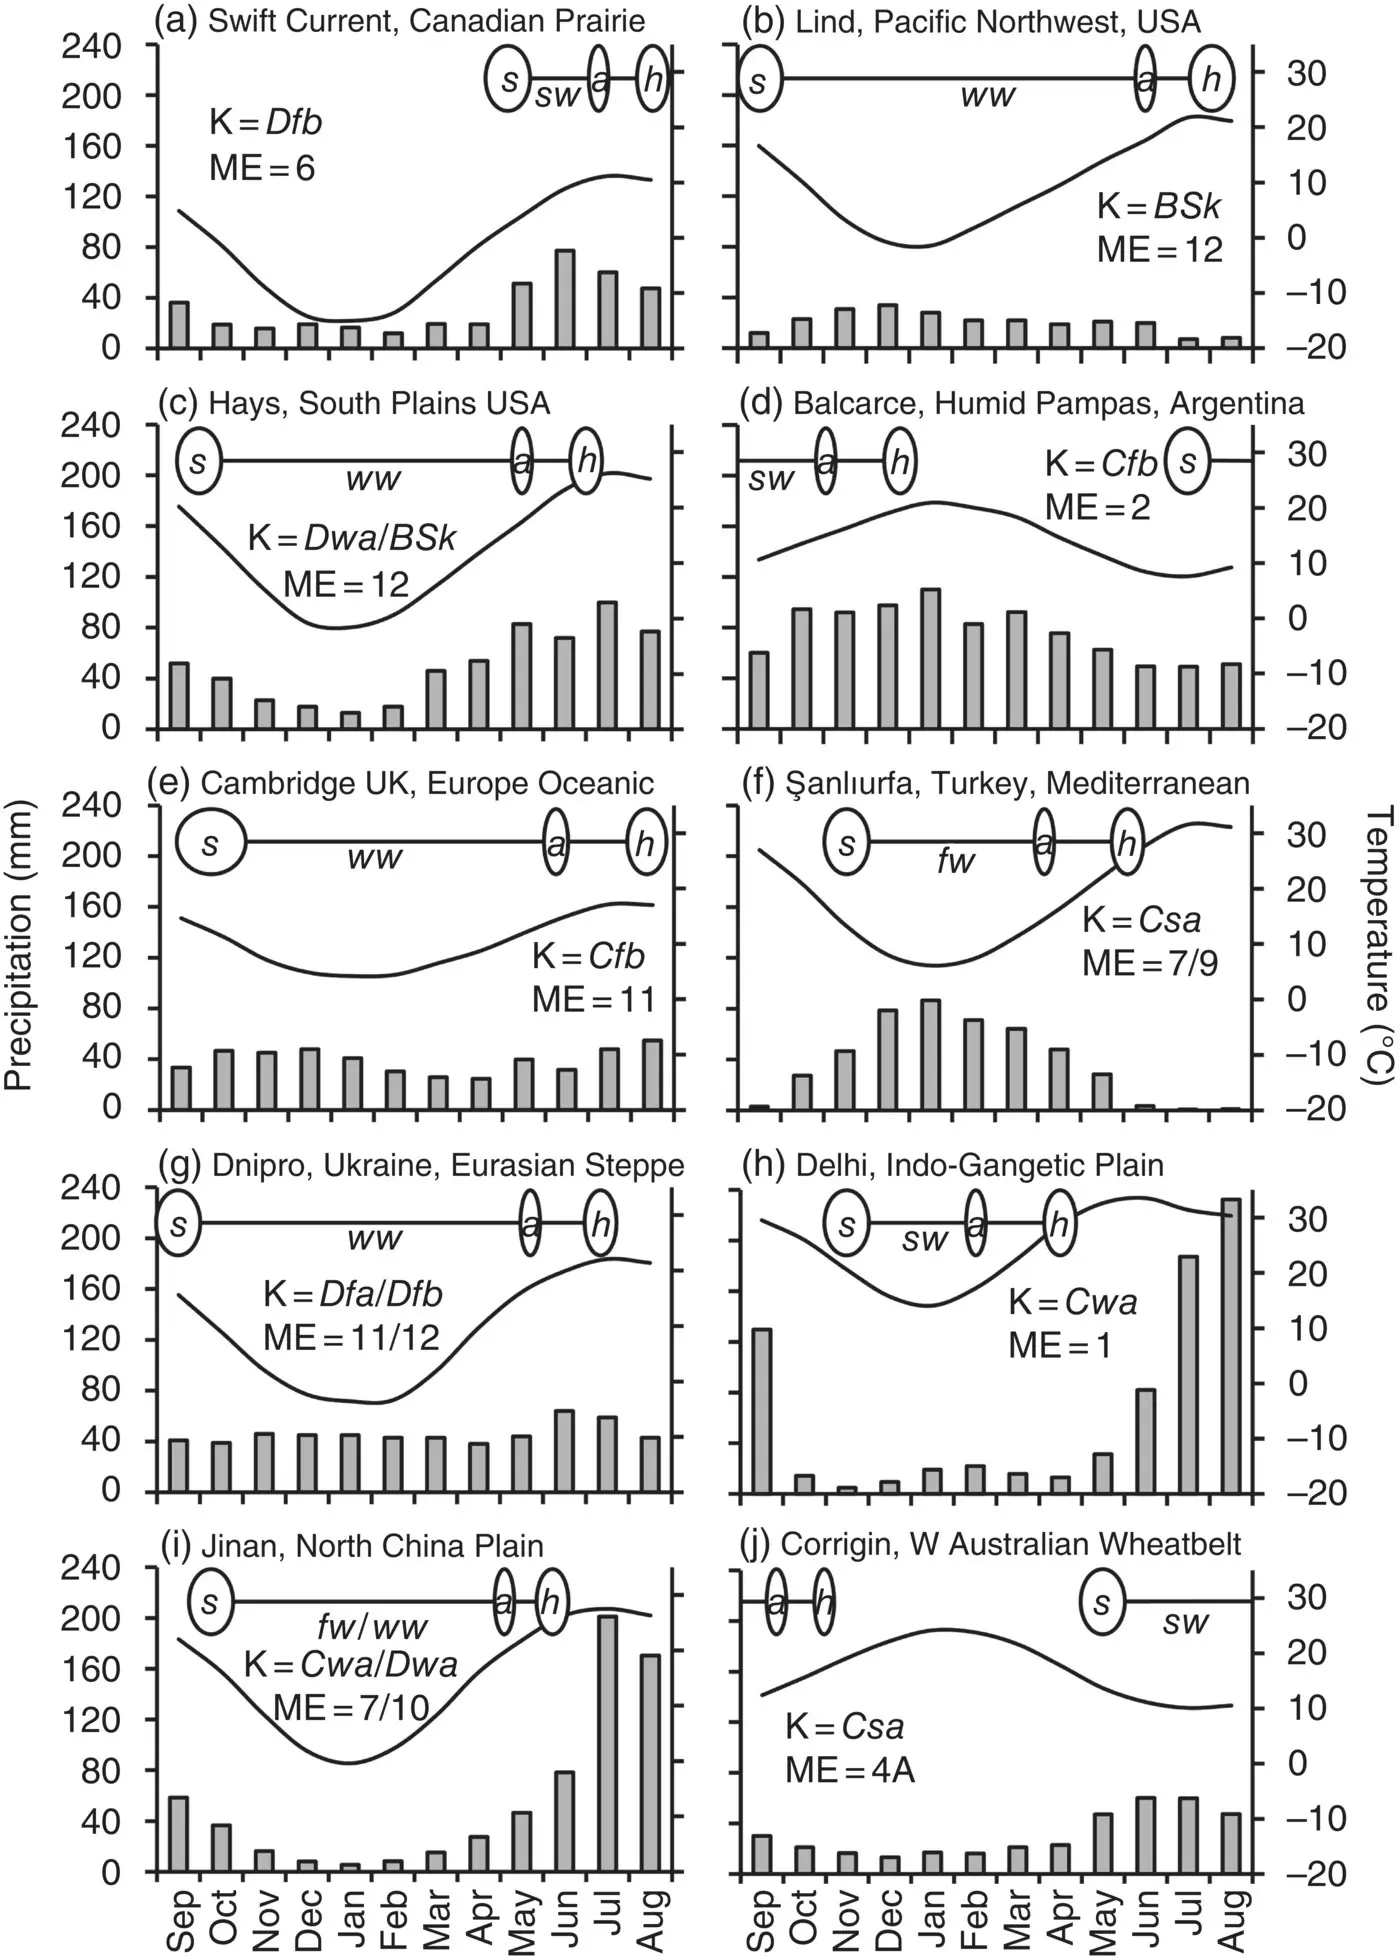
Figure 1.6 Mean temperature (line) and precipitation (bars) for locations in the 10 wheat growing regions labelled in Figure 1.2. Typical timings for sowing, flowering (anthesis), and harvest at location are denoted by s , a , and h, respectively. Wheat types ( Section 1.2) are spring wheat ( sw ), facultative wheat ( fw ), and winter wheat ( ww ). K is the Köppen climate classification ( Table 1.2), and M is the mega‐environment ( Table 1.3) for the location. Note: both climate and mega‐environment can vary significantly within the growing regions. Mega‐environments and wheat types (and hence different cropping seasons) can also overlap at the same location (
Gbegbelegbe et al. 2017).
In the Köppen climate classification system, wheat production spans the semi‐arid, temperate, and continental zones ( Table 1.2). For breeding purposes, particularly for the developing world, the International Maize and Wheat Improvement Centre (i.e. CIMMYT: Centro Internacional de Mejoramiento de Maíz y Trigo) has divided wheat‐growing areas into mega‐environments, which again emphasise the wide adaption of the crop ( Table 1.3).
It is evident that the different growing environments contribute to a diversity of cropping systems, varying in sowing and harvest dates, rotational contexts, and the use of irrigation. The environment also plays a large role in determining the justification of inputs such as mineral fertilizers and crop protection agrochemicals. For example, although national production levels of wheat in the UK and Kazakhstan are similar, the two countries contrast in how these levels are achieved ( Table 1.1). In Kazakhstan, low yields per hectare are produced over a large area where wheat growth is mostly limited by low water availability ( Chapter 3) and high temperatures ( Chapter 4). Much of the wheat is planted as late as May, giving a short growing season, but still exposed to abiotic stresses. By contrast, in the UK high land‐use efficiency is achieved on a much smaller area. Growth proceeds in clement conditions where yield is, therefore, mostly limited by light interception ( Chapter 5). Most of the wheat grown in the UK is planted early in the autumn and proceeds to harvest over a period of 10–11 months. If, as in the UK, abiotic stresses are less frequently severe, wheat crops are particularly responsive to inputs, such as fertilizer and agrochemical applications. Together, these inputs serve to maximise light capture and therefore photosynthesis and yield ( Chapter 6).
The environment clearly has an impact on wheat supply and, conversely, wheat influences the environment. If we are to address the sustainability of wheat production, both factors need to be understood. Our current reliance on cereal grain, and on wheat in particular, has significant implications for human health and well‐being. The relationships between wheat production, the environment, and human diet and health are therefore the overarching themes of this book.
For the remainder of this chapter, we will introduce three of the main factors that account for the global success of the wheat crop. Firstly, the wheat plant is described in terms of its growth and development as a grass. Secondly, we introduce the evolution of wheat and explain its wide adaptability. Finally, we introduce the unique processing properties of wheat and the diversity of wheat grain types and wheat‐based products.
As already said, wheat, like other cereals, is a grass plant grown primarily for its edible seed. The lineages of wheat, rice, and maize may have diverged from a common ancestor about 40 MYA (Huang et al. 2002; Gill et al. 2004). The wheats ( Triticum spp.) form part of the Triticeae tribe, which also includes closely related cereals, notably barley ( Hordeum vulgare ) and rye ( Secale cereale ), as well as many wild grasses, such as the weed common couch grass ( Elymus repens ). The lineages of wheat and barley appear to have separated 10–14 MYA, and of wheat and rye 7 MYA.
Table 1.2 Köppen climate classifications used in Figure 1.6.
Source: adapted from Peel et al. (2007).
| Grouping |
Water distribution |
Temperature description |
Composite classification |
| B Desert/semi‐arid |
|
S Semi‐arid a |
|
|
|
|
k cold b |
BSk |
| C Temperate/mesothermal c |
|
s Dry summer d(Mediterranean) |
|
|
|
|
a Hot summer e |
Csa |
|
w Dry winter f(e.g. subtropical) |
|
|
|
|
a Hot summer e |
Cwa |
|
f No dry season (e.g. oceanic) |
|
|
|
|
b Warm summer g |
Cfb |
| D Continental/microthermal h |
|
w Dry winter f |
|
|
|
|
a Hot summer e |
Dwa |
|
f No dry season |
|
|
|
|
a Hot summer e |
Dfa |
|
|
b Warm summer g |
Dfb |
Definitions:
a‘Semi‐arid’ is where the mean annual precipitation is > 5× but < 10 × a threshold precipitation. When precipitation is relatively evenly distributed, the threshold precipitation is 2 × mean annual temperature (°C) +14.
b‘Cold’ is where mean annual temperature is < 18 °C.
c‘Temperate’ is where the mean temperature of the hottest month is > 10 °C and the coldest month is between 0 and 18 °C.
dA ‘dry summer’ is where the precipitation in the driest summer month is < 40 mm and also less than a third of the wettest month in winter.
eA ‘hot summer’ is where the mean temperature of the hottest month is ≥ 22 °C.
fA ‘dry winter’ is where the wettest winter month has less than a tenth of the precipitation than the wettest summer month.
gA ‘warm summer’ is where the hottest month is < 22 °C but there are at least four months where the mean temperature is > 10 °C.
hA continental climate is where the hottest month is > 10 °C but the coldest month is ≤ 0 °C.
The Triticeae have common structures and patterns of development typical of many grasses. It is normal to define phases of development in terms of growth stage scores ( Table 1.4; Figure 1.7). Growth stage scores are used extensively to interpret the effects of the environment on crop growth and yield, and to optimize the timings of agronomic treatments including irrigation and the application of fertilizers, growth regulators, and crop protection agrochemicals (Barber et al. 2015). They can also be used to define safe grazing periods for dual‐purpose crops (Gooding et al. 1998). The most widely used growth stage scoring method for wheat, and that used throughout this book, is the decimal growth stage (DGS) system of Zadoks et al. (1974). Equivalents between the Feekes and Zadoks scales are given in Table 1.4. Equivalents with lesser‐used scoring systems are provided by Landes and Porter (1989) and Harrell et al. (1993, 1998).
Table 1.3 Mega‐Environments (ME) for wheat.
Source: Adapted from Rajaram et al. (1993) and Gbegbelegbe et al. (2017).
Читать дальше


