Yves Charbit - Demographic Dynamics and Development
Здесь есть возможность читать онлайн «Yves Charbit - Demographic Dynamics and Development» — ознакомительный отрывок электронной книги совершенно бесплатно, а после прочтения отрывка купить полную версию. В некоторых случаях можно слушать аудио, скачать через торрент в формате fb2 и присутствует краткое содержание. Жанр: unrecognised, на английском языке. Описание произведения, (предисловие) а так же отзывы посетителей доступны на портале библиотеки ЛибКат.
- Название:Demographic Dynamics and Development
- Автор:
- Жанр:
- Год:неизвестен
- ISBN:нет данных
- Рейтинг книги:3 / 5. Голосов: 1
-
Избранное:Добавить в избранное
- Отзывы:
-
Ваша оценка:
Demographic Dynamics and Development: краткое содержание, описание и аннотация
Предлагаем к чтению аннотацию, описание, краткое содержание или предисловие (зависит от того, что написал сам автор книги «Demographic Dynamics and Development»). Если вы не нашли необходимую информацию о книге — напишите в комментариях, мы постараемся отыскать её.
Demographic Dynamics and Development — читать онлайн ознакомительный отрывок
Ниже представлен текст книги, разбитый по страницам. Система сохранения места последней прочитанной страницы, позволяет с удобством читать онлайн бесплатно книгу «Demographic Dynamics and Development», без необходимости каждый раз заново искать на чём Вы остановились. Поставьте закладку, и сможете в любой момент перейти на страницу, на которой закончили чтение.
Интервал:
Закладка:
An even more detailed analysis reveals differences within these three continents, especially in Asia and Africa. Thus, sub-Saharan Africa is growing at a rate of 2.65% per year, but this average masks deep contrasts: 1.91% in the north and 1.39% in the south, against 3.05% in Middle Africa and 2.67% in the continent’s east and west. Western and Central Asia are growing faster (1.64%) than East (0.40%) and Southern (1.20%) Asia. The differences between countries in the same region are just as remarkable ( Table I.2and Figure I.2). Size effects play a large part: highly populated countries (South Africa, India, China), often giants relative to their neighbors, weigh heavily on the averages of the sub-regions. South Africa, with its 59.3 million inhabitants (85% of the total) and a rate of 1.37%, largely determines the rate of growth in the sub-region (1.39%), whereas Botswana, which barely totals 2.3 million, is growing much faster (2.07%).
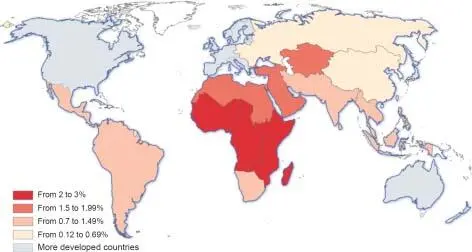
Figure I.1. Annual growth rate of major groups (2015–2020 average, in %)
(sources: Charbit (design); Opurez, IRD-Ceped (realization)). For a color version of this figure, see www.iste.co.uk/charbit/demographic.zip
Similarly, in Central and Southern Asia, India (1,380 billion with a growth rate of 1.04% per year), Pakistan (220 million and 2.05%) and Bangladesh (164 million and 1.05%) largely determine the sub-regional rate (1.20%), since these three countries on their own account for 90.9% of the sub-region’s total population. Finally, Western Asia, which includes countries with high growth rates (Iraq 2.46%, Palestine 2.38%, Yemen 2.37%), contrasts with other Asian sub-regions: 1.64% against 0.40% in East Asia, for example. This low rate is explained by China’s slow growth (0.46%), a demographic giant of 1,344 billion inhabitants, which represents 80.3% of the population in this sub-region.
What is more, the major dichotomy between developed and developing countries is questionable because, in some countries considered to be developing, fertility rates are lower than in some industrialized countries. This is the case for China (1.69 children per woman) compared to France (1.85), the United Kingdom (1.75) and the United States (1.78). From this brief statistical analysis, it is clear that, although convenient, the concept of world population covers an extraordinary diversity of demographic situations. For this reason, two typologies will be used in the following chapters when providing indicators of the relationship between population and development: the continents, on the one hand, and, on the other, the countries classified according to their level of income (high, middle and low).
Table I.2. Annual growth rate per country in certain sub-regions (2015–2020 average)
| Region and country | % | Region and country | % |
| Southern Africa | 1.39 | West Asia | 1.64 |
| Botswana | 2.07 | Armenia | 0.26 |
| Eswatini | 0.99 | Azerbaijan | 1.05 |
| Lesotho | 0.79 | Bahrain | 4.31 |
| Namibia | 1.86 | Cyprus | 0.78 |
| South Africa | 1.37 | Georgia | –0.18 |
| Southern Asia | 1.20 | Iraq | 2.46 |
| Afghanistan | 2.47 | Israel | 1.63 |
| Bangladesh | 1.05 | Jordan | 1.93 |
| Bhutan | 1.17 | Kuwait | 2.15 |
| India | 1.04 | Lebanon | 0.88 |
| Iran | 1.36 | Oman | 3.59 |
| Maldives | 3.45 | Qatar | 2.32 |
| Nepal | 1.51 | Saudi Arabia | 1.86 |
| Pakistan | 2.05 | Palestine | 2.38 |
| Sri Lanka | 0.48 | Syria | –0.56 |
| Turkey | 1.43 | ||
| United Arab Emirates | 1.31 | ||
| Yemen | 2.37 |
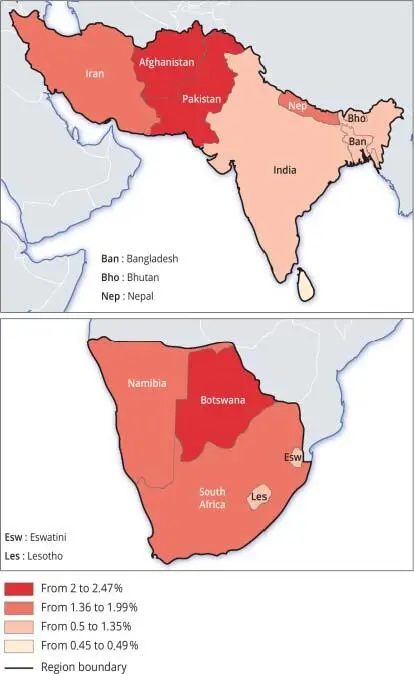
Figure I.2. Annual growth rate of countries in Southern Africa and Southern Asia (2015–2020 average)
(sources: Charbit (design); Opurez, IRD-Ceped (realization)). For a color version of this figure, see www.iste.co.uk/charbit/demographic.zip
I.3. The double Malthusian progression
Let us move on to economy, the other term of the dialectic between population and development. Alongside China, which has now become the world’s second economic power, we have seen the emergence of the Dragons (South Korea, Taiwan, Hong Kong and Singapore) and the Tigers (Malaysia, Thailand, Indonesia, Vietnam and the Philippines) in Southeast Asia. Several countries in the Middle East (the Gulf countries and Iran), Latin America (Venezuela) and Africa (Algeria and Libya) have used oil and gas revenues politically and economically. As for the enormous potential of mining resources in Africa, the soaring prices of raw materials and of basic foodstuffs have resulted in a much higher gross domestic product (GDP) than in Europe, between 2000 and 2015. All of a sudden, the classic parallel drawn between demographic and economic growth has lost much of its meaning and, moreover, the pithy claim that the cause of poverty is the rapid growth of the population, itself driven by a high fertility rate, has been denied by developments in recent decades. This central question is therefore: Is demography the cause of underdevelopment?
Why is this claim so widely accepted today? Here, it is appropriate to recall the theory proposed by Thomas Robert Malthus in 1798. In his view, just like animal species, England’s poor behaved completely irresponsibly: unable to control their sexual impulses, they had far too many children relative to their meager resources (Malthus 1798). Under these conditions, they had to be held responsible for their misery. In this way, the economic and social inequalities created or reinforced by the policies of 19th-century European conservative governments (Charbit 1983, 2009) were legitimized. However, Malthus fell into oblivion from the mid-19th century with the decline in fertility of industrialized countries, to the point of fearing that low birth rates would eventually lead to the demographic decline of old Europe. The situation then took a new turn from the 1950s onwards with the realization of growing demographic trends in poor countries, especially in Asia. Western scientific and political circles were alarmed at the risk of an explosion in world population. In 1968, the work of biologist Paul Ehrlich, The Population Bomb , had a huge impact. But while Ehrlich focused on the global level and addressed the issue of natural resource reserves in particular, it quickly appeared that the problem was not so much world population but rapid population growth in “Third World” countries – to use the term of those times – namely India with its demographic mass of 543 million in 1969 out of a world total of 3,625 billion that year. In short, according to the vision of the 1960s, largely inspired by neo-Malthusian ideas, the population of the Third World was increasing too quickly in relation to resources. Why “the Third World”?
Читать дальшеИнтервал:
Закладка:
Похожие книги на «Demographic Dynamics and Development»
Представляем Вашему вниманию похожие книги на «Demographic Dynamics and Development» списком для выбора. Мы отобрали схожую по названию и смыслу литературу в надежде предоставить читателям больше вариантов отыскать новые, интересные, ещё непрочитанные произведения.


Обсуждение, отзывы о книге «Demographic Dynamics and Development» и просто собственные мнения читателей. Оставьте ваши комментарии, напишите, что Вы думаете о произведении, его смысле или главных героях. Укажите что конкретно понравилось, а что нет, и почему Вы так считаете.