Remote Sensing of Water-Related Hazards
Здесь есть возможность читать онлайн «Remote Sensing of Water-Related Hazards» — ознакомительный отрывок электронной книги совершенно бесплатно, а после прочтения отрывка купить полную версию. В некоторых случаях можно слушать аудио, скачать через торрент в формате fb2 и присутствует краткое содержание. Жанр: unrecognised, на английском языке. Описание произведения, (предисловие) а так же отзывы посетителей доступны на портале библиотеки ЛибКат.
- Название:Remote Sensing of Water-Related Hazards
- Автор:
- Жанр:
- Год:неизвестен
- ISBN:нет данных
- Рейтинг книги:5 / 5. Голосов: 1
-
Избранное:Добавить в избранное
- Отзывы:
-
Ваша оценка:
Remote Sensing of Water-Related Hazards: краткое содержание, описание и аннотация
Предлагаем к чтению аннотацию, описание, краткое содержание или предисловие (зависит от того, что написал сам автор книги «Remote Sensing of Water-Related Hazards»). Если вы не нашли необходимую информацию о книге — напишите в комментариях, мы постараемся отыскать её.
Remote Sensing of Water-Related Hazards Remote Sensing of Water-Related Hazards
The American Geophysical Union promotes discovery in Earth and space science for the benefit of humanity. Its publications disseminate scientific knowledge and provide resources for researchers, students, and professionals.
Remote Sensing of Water-Related Hazards — читать онлайн ознакомительный отрывок
Ниже представлен текст книги, разбитый по страницам. Система сохранения места последней прочитанной страницы, позволяет с удобством читать онлайн бесплатно книгу «Remote Sensing of Water-Related Hazards», без необходимости каждый раз заново искать на чём Вы остановились. Поставьте закладку, и сможете в любой момент перейти на страницу, на которой закончили чтение.
Интервал:
Закладка:
(5) 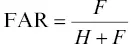
(6) 
where H is the number of hit events where both reference and target data sets detect positive precipitation, M is the number of missed events where the reference data set detects precipitation but the target data set neither, and F is the number of false alarms, which is inverse with M. The calculation of CSI requires a threshold to determine rain/no rain events. Usually, a value larger than zero such as 1 mm/d is adopted because both gauges and satellite/reanalysis are prone to large uncertainties for light precipitation. However, a unified threshold can either be too large for dry regions or too small for humid regions. For example, the 1 mm/d threshold will result in the loss of many light precipitation samples in TP, XJ, and NE. Therefore, this study adopts the smaller one between the 20th percentile of mean daily precipitation and 1 mm/d, meaning that varying rain/no rain thresholds are applied for each rain gauge. Thus, there are enough samples for the validation of precipitation data sets even in arid regions. However, it should be noted that dynamic thresholds result in nonuniform evaluation criteria in space. Since our major objective lies in the comparison between different data sets, this problem is largely avoided.
2.3.2. Triple Collocation
The precipitation phase can be divided into rainfall, snowfall, and a mix of both. Snowfall measurements often contain larger uncertainties compared to liquid rainfall, and thus evaluation of snowfall based on CGDPA may not be suitable. To break through this limitation, we used an objective analysis method, i.e., the triple collocation (TC; Stoffelen, 1998). TC can estimate the RMSE of three independent inputs without knowing the “truth.” The inputs are precipitation data sets from different sources in this study (i.e., gauges, satellite sensors, and reanalysis models), sources that are independent of each other. Alemohammad et al. (2015) developed the multiplicative TC (MTC), which is more suitable to estimate the errors of precipitation. The MTC has proved superior to the additive model used by the original TC. The formulas are as below:
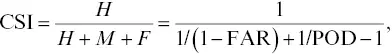
(7) 
(8) 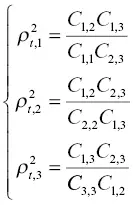
where C i, j( i = 1,2,3; j = 1,2,3) is the covariance between two inputs in the triplet, σ iis RMSE, and  is the CC between the truth and product i . This study employs the MTC method to estimate the CC and RMSE of gauge, IMERG, and reanalysis snowfall products. The three data sources are independent of each other and satisfy the requirement of MTC.
2.3.3. Flash Flood Warning
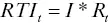
The RTI method has been applied to flash flood warnings, which effectively reduced the casualties caused by flash floods (Clark et al., 2014). Because flash floods are mainly caused by short‐duration intense rainfall, the RTI method predicts flash floods by considering the effective cumulative rainfall ( R t) and rainfall intensity ( I ) seven days before the flash flood occurrence. Based on the historical rainfall, the method obtains the flash flood probability under different rainfall conditions by calculating RTI and then divides the critical rainfall map into three regions for early warning (low, medium, and high possibility).
For rainfall events, the start time is defined as hourly rainfall exceeding 4 mm, and the end time is hourly rainfall falling below 4 mm for 6 consecutive hours. Then, the rainfall data corresponding to each flash flood disaster is selected. If there is no monitoring station in the flash flood disaster area, the rainfall data of the nearest monitoring station shall be employed. The RTI equation is as follows:
(9) 
(10) 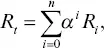
where RTI tis the RTI calculated at time t ; I is the rainfall intensity; R tis the effective cumulative rainfall; i means the antecedent day number from one to n; α is the rainfall attenuation coefficient, mainly taken from the measured value of 0.78 in Jiangjiagou, Yunnan Province; α iis the reduction factor of the previous i day; and R iis the 24‐hour cumulative rainfall of the previous i ‐day, where the initial cumulative rainfall R 0is 50 mm, which is mainly obtained through actual statistical analysis.
Since previous rainfall was calculated using t days of accumulated rainfall, the false alarms rate is higher in certain rainfall patterns (e.g., long‐term duration and low rainfall intensity). In addition, this method does not consider the effect of intermittent rainfall and rainfall segmentation, etc. Chen et al. (2017) proposed the improved RTI method, and the equation is as follows:
(11) 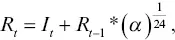
where I tis the current rainfall intensity at time t (mm/h) and R t–1is the effective cumulative rainfall one hour earlier. In equation (10), each operation needs to calculate R iseparately, multiply by α i, and then accumulate. However, in equation (11), only rainfall intensity and accumulated rainfall are required, which greatly reduces the amount of calculation and contributes to subsequent large‐scale calculations.
2.4. RESULTS
2.4.1. Overall Performance
Figure 2.3shows the spatial distribution of KGE' for different precipitation products in China. IMERG_uncal represents the estimated value of IMERG microwave infrared without gauge adjustment, while IMERG_cal combines IMERG_uncal and GPCC gauge analysis on a monthly basis. The comparison between IMERG_cal and IMERG_uncal can clarify two important questions: (1) What is the best quality that can be achieved by pure satellite estimation, and (2) How useful is the rain gauge adjustment?
SM2RAIN has the worst performance compared to other products. About 90% of the rain gauges have a KGE' less than 0.6; this is expected because the rain gauge information is not included. SM2RAIN achieved the highest KGE' value in the central region, which is equivalent to areas with less rainfall in Inner Mongolia. In contrast, satellite products such as IMERG_uncal, PCDR, and CHIRPS perform best in areas with ample precipitation. We assume that the reason could be SM2RAIN relies on soil moisture to estimate precipitation, and in humid areas, the soil is usually saturated and cannot well reflect changes in precipitation. Due to the influence of snow and permafrost, SM2RAIN lacks TP data.
Читать дальшеИнтервал:
Закладка:
Похожие книги на «Remote Sensing of Water-Related Hazards»
Представляем Вашему вниманию похожие книги на «Remote Sensing of Water-Related Hazards» списком для выбора. Мы отобрали схожую по названию и смыслу литературу в надежде предоставить читателям больше вариантов отыскать новые, интересные, ещё непрочитанные произведения.


Обсуждение, отзывы о книге «Remote Sensing of Water-Related Hazards» и просто собственные мнения читателей. Оставьте ваши комментарии, напишите, что Вы думаете о произведении, его смысле или главных героях. Укажите что конкретно понравилось, а что нет, и почему Вы так считаете.