Remote Sensing of Water-Related Hazards
Здесь есть возможность читать онлайн «Remote Sensing of Water-Related Hazards» — ознакомительный отрывок электронной книги совершенно бесплатно, а после прочтения отрывка купить полную версию. В некоторых случаях можно слушать аудио, скачать через торрент в формате fb2 и присутствует краткое содержание. Жанр: unrecognised, на английском языке. Описание произведения, (предисловие) а так же отзывы посетителей доступны на портале библиотеки ЛибКат.
- Название:Remote Sensing of Water-Related Hazards
- Автор:
- Жанр:
- Год:неизвестен
- ISBN:нет данных
- Рейтинг книги:5 / 5. Голосов: 1
-
Избранное:Добавить в избранное
- Отзывы:
-
Ваша оценка:
Remote Sensing of Water-Related Hazards: краткое содержание, описание и аннотация
Предлагаем к чтению аннотацию, описание, краткое содержание или предисловие (зависит от того, что написал сам автор книги «Remote Sensing of Water-Related Hazards»). Если вы не нашли необходимую информацию о книге — напишите в комментариях, мы постараемся отыскать её.
Remote Sensing of Water-Related Hazards Remote Sensing of Water-Related Hazards
The American Geophysical Union promotes discovery in Earth and space science for the benefit of humanity. Its publications disseminate scientific knowledge and provide resources for researchers, students, and professionals.
Remote Sensing of Water-Related Hazards — читать онлайн ознакомительный отрывок
Ниже представлен текст книги, разбитый по страницам. Система сохранения места последней прочитанной страницы, позволяет с удобством читать онлайн бесплатно книгу «Remote Sensing of Water-Related Hazards», без необходимости каждый раз заново искать на чём Вы остановились. Поставьте закладку, и сможете в любой момент перейти на страницу, на которой закончили чтение.
Интервал:
Закладка:
2.2.2. Datasets
Rain gauge data
A gridded station‐based precipitation product, the Chinese Rain Gauge‐based Daily Precipitation Analysis (CGDPA), is used to evaluate the quality of different precipitation products. CGDPA is developed by the China Meteorological Administration (CMA) (Shen & Xiong, 2016). It uses the optimal interpolation to obtain a 0.25° continuous precipitation map and daily resolution based on around 2400 national rain gauges ( Figure 2.1a). CGDPA also implicitly considers the topographic effect on precipitation. Due to the high density of stations and well‐designed interpolation methods, CGDPA has high accuracy and has been widely used as the reference for satellite/reanalysis precipitation assessment (Tang, Ma, et al., 2016). Noted that the evaluation only involves grids that contain at least one rain gauge to ensure the reliability of results. The period is from 2000 to 2018, which covers the retrospective period of IMERG.
Critical flash flood data
Critical rainfall is defined as the value when the flow reaches the early warning flow. In this work, the critical rainfall in Yunnan Province is collected from the China rainstorm parameters atlas. However, it should be noted that this critical rainfall may not agree with the spatial resolution of gridded IMERG data, which could to some extent affect the flood warning. In total, 120 flash floods were recorded during 2015–2018.
Satellite and reanalysis precipitation products
There are seven satellite precipitation data sets and three reanalysis data sets evaluated, as shown in Table 2.1. The reanalysis products are involved because they are important sources of global precipitation data, and comparison with reanalysis products can deepen our understanding of satellite products.
IMERG V06, as the latest release version, has undergone major improvements compared with previous versions. First, IMERG V06 uses total precipitable water vapor to replace geostationary infrared data to calculate the morphing vectors of precipitation systems. Second, IMERG V06 includes data from more sensors such as the TRMM microwave imager (TMI) and the Megha‐Tropiques SAPHIR. Third, passive microwave estimates are morphed at high latitudes to diminish spatial gaps. Please refer to official documents for a more detailed description. IMERG generates three products, i.e., the near‐real‐time Early and Late runs and the post‐real‐time Final run.

Figure 2.2 Topographical map and locations of flash flood events from 2011 to 2018 in Yunnan province,
Source: Based on Tang et al. (2020), Figure 01B, p 03 / Elsevier. based on Ma et al. (2020), Figure 01, p 04 / MDPI / CC BY 4.0.
Table 2.1 Summary of satellite and reanalysis precipitation data sets used in this study.
| Data set | Full name of the data set | Resolution | Period | Reference |
|---|---|---|---|---|
| Satellite Precipitation Data Set | ||||
| IMERG | Integrated Multi‐satellitE Retrievals for GPM Fina run V06B | 0.1°/0.5 h | 2006–present | Huffman et al., (2019) |
| T3B42 | TRMM Multi‐satellite Precipitation Analysis (TMPA) 3B42 V7 | 0.25°/3 h | 1998–present | Huffman et al. (2007) |
| CMORPH | Climate Prediction Center (CPC) MORPHing technique bias corrected (CRT) | 0.25°/3 h | 1998–present | Joyce et al. (2004) |
| PCDR | PERSIANNClimate Data Record | 0.25°/1 d | 1983–present | Ashouri et al. (2015) |
| GSMaP | Gauge‐adjusted Global Satellite Mapping of Precipitation V6/V7 | 0.1°/1 h | 2000–present | Mega et al. (2014) |
| CHIRPS | Climate Hazards group Infrared Precipitation with Stations | 0.05°/1 d | 1981–present | Funk et al. (2015) |
| SM2RAIN | SM2RAIN based on ESA Climate Change Initiative (CCI) | 0.25°/1 d | 1998–2015 | Ciabatta et al. (2015) |
| Reanalysis Precipitation Data Set | ||||
| ERA5 | Fifth generation of ECMWF atmospheric reanalyses of the global climate | ~0.25°/1 h | 1979–present | Hersbach et al. (2020) |
| ERA‐Interim | ECMWF ReAnalysis Interim | ∼0.75°/3 h | 1979–present | Dee et al. (2011) |
| MERRA2 | The Modern‐Era Retrospective Analysis for Research and Applications, Version 2 | ~0.5°×0.625°/1 h | 1980–present | Gelaro et al. (2017) |
TMPA 3B42 V7 (T3B42) is the precursor of IMERG. Both IMERG Final run and T3B42 are corrected using the station‐based Global Precipitation Climatology Center (GPCC). CMORPH and GSMaP are corrected using CPC daily analysis. The PERSIANN Climate Data Record (PCDR) is obtained by adjusting the PERSIANN estimate using GPCC monthly precipitation. CHIRPS (Climate Hazards group Infrared Precipitation with Stations) uses five public metering data streams and several private files detailed in Funk et al. (2015). SM2RAIN is produced using satellite soil moisture data.
The three reanalysis products involved are ERA‐Interim, ERA5, and MERRA‐2. Among them, ERA5 is the fifth generation of global reanalysis conducted by the European Center for Medium‐Range Weather Forecast (ECMWF).
All satellites and reanalysis products are resampled to 0.25° resolution and accumulated to a daily scale to facilitate the evaluation based on CGDPA.
2.3. METHODOLOGY
2.3.1. Statistic Metrics
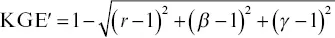
Different types of statistical metrics are applied to evaluate the accuracy of various precipitation products, including the Pearson correlation coefficient (CC), mean error (ME), and root mean square error (RMSE), which are widely used in previous studies. We also used the Kling‐Gupta efficiency (KGE') statistics proposed by Gupta et al. (2009) and modified by Kling et al. (2012). KGE' considers the contribution of correlation, deviation, and variability, and its calculation formula is as follows:
(1) 
(2) 
(3) 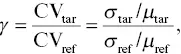
where r is the CC between reference (abbreviated as ref) and target (abbreviated as tar), β is the bias ratio, γ is the variability ratio, μ is the mean precipitation, CV is the coefficient of variation, and σ is the standard deviation of precipitation. KGE' ranges between negative infinity and 1.
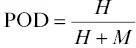
In addition, the critical success index (CSI) as a representative of contingency metrics is utilized to demonstrate the capability of precipitation products in detecting precipitation occurrence. CSI is expressed as a function of the probability of detection (POD) and false alarm ratio (FAR), and is calculated as below:
(4) 
Интервал:
Закладка:
Похожие книги на «Remote Sensing of Water-Related Hazards»
Представляем Вашему вниманию похожие книги на «Remote Sensing of Water-Related Hazards» списком для выбора. Мы отобрали схожую по названию и смыслу литературу в надежде предоставить читателям больше вариантов отыскать новые, интересные, ещё непрочитанные произведения.


Обсуждение, отзывы о книге «Remote Sensing of Water-Related Hazards» и просто собственные мнения читателей. Оставьте ваши комментарии, напишите, что Вы думаете о произведении, его смысле или главных героях. Укажите что конкретно понравилось, а что нет, и почему Вы так считаете.