Louis Theodore - Introduction to Desalination
Здесь есть возможность читать онлайн «Louis Theodore - Introduction to Desalination» — ознакомительный отрывок электронной книги совершенно бесплатно, а после прочтения отрывка купить полную версию. В некоторых случаях можно слушать аудио, скачать через торрент в формате fb2 и присутствует краткое содержание. Жанр: unrecognised, на английском языке. Описание произведения, (предисловие) а так же отзывы посетителей доступны на портале библиотеки ЛибКат.

- Название:Introduction to Desalination
- Автор:
- Жанр:
- Год:неизвестен
- ISBN:нет данных
- Рейтинг книги:3 / 5. Голосов: 1
-
Избранное:Добавить в избранное
- Отзывы:
-
Ваша оценка:
Introduction to Desalination: краткое содержание, описание и аннотация
Предлагаем к чтению аннотацию, описание, краткое содержание или предисловие (зависит от того, что написал сам автор книги «Introduction to Desalination»). Если вы не нашли необходимую информацию о книге — напишите в комментариях, мы постараемся отыскать её.
Introduction to Desalination — читать онлайн ознакомительный отрывок
Ниже представлен текст книги, разбитый по страницам. Система сохранения места последней прочитанной страницы, позволяет с удобством читать онлайн бесплатно книгу «Introduction to Desalination», без необходимости каждый раз заново искать на чём Вы остановились. Поставьте закладку, и сможете в любой момент перейти на страницу, на которой закончили чтение.
Интервал:
Закладка:
Various symbols are universally employed to represent equipment, parts, valves, piping, etc. Some of these are depicted in the schematic in Figure 3.2. Although a significant number of these symbols are used to describe chemical and petrochemical processes, only a few are needed for simpler facilities. These symbols obviously reduce, and in some instances replace, detailed written descriptions of the process. Note that many of the symbols are pictorial, which helps in better describing process components, units, and equipment (Theodore 2014).
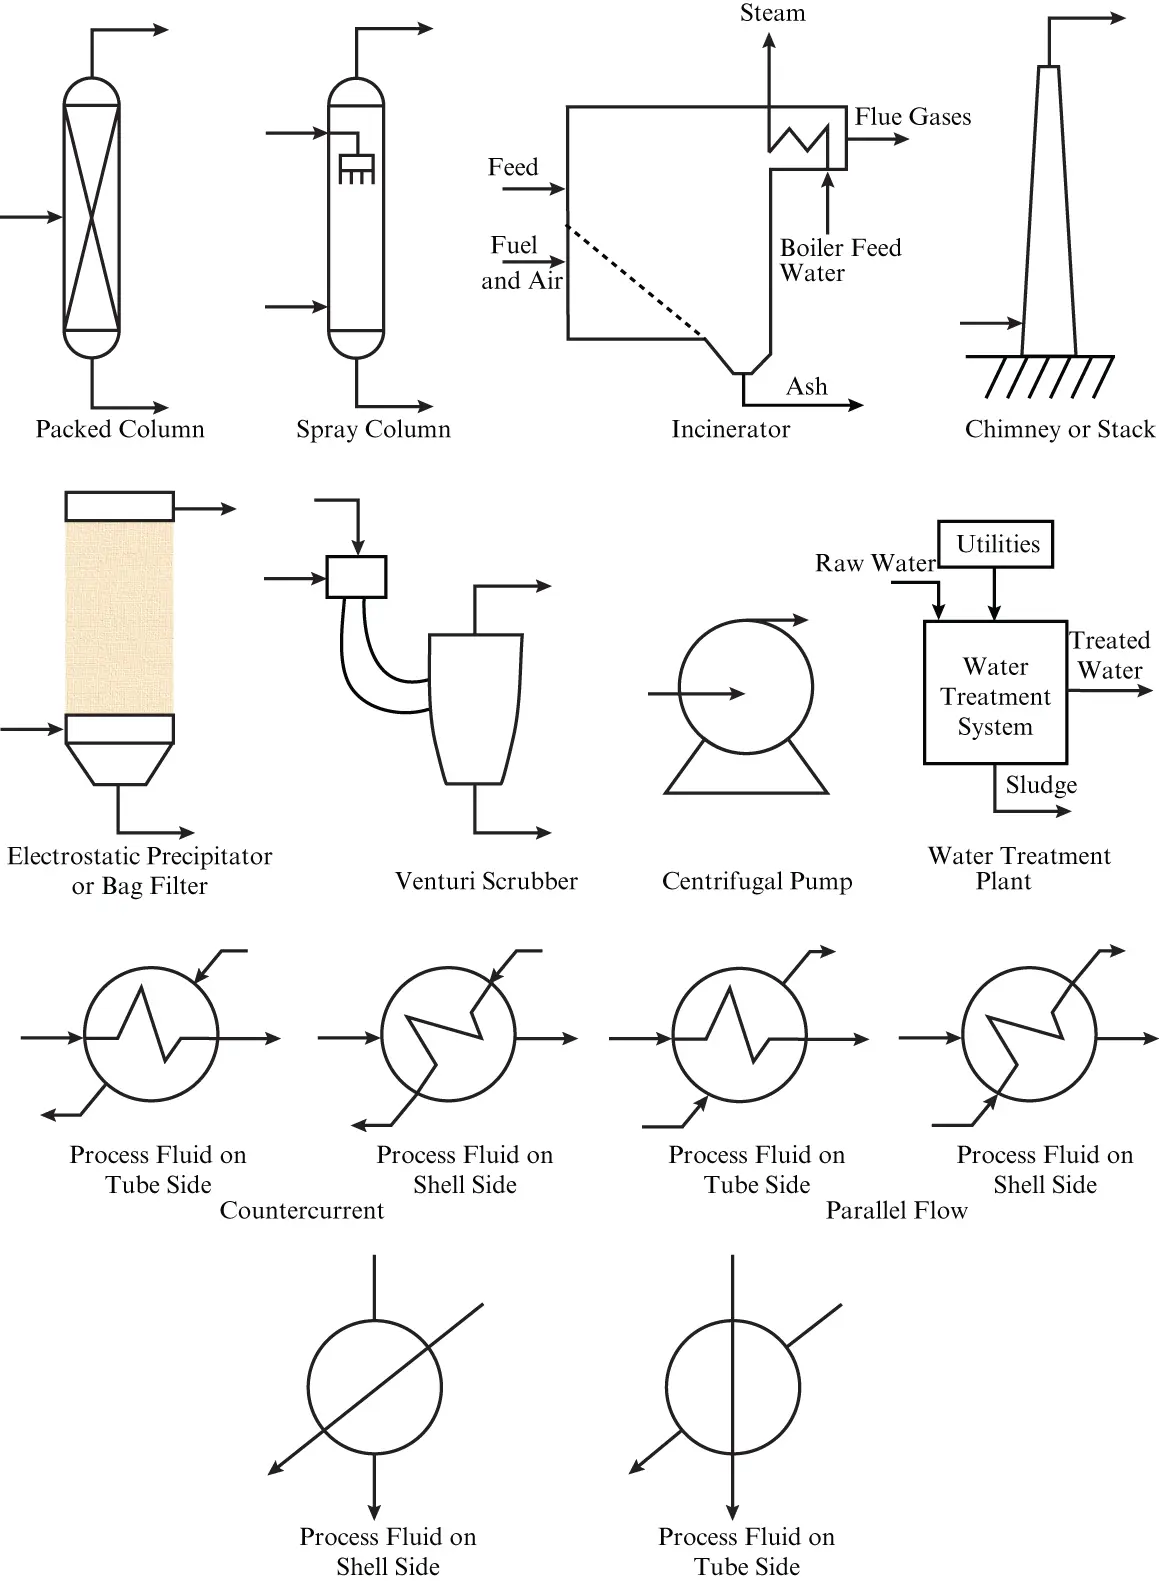
Figure 3.2 Common process flow diagram symbols.
The degree of sophistication and details of a process flow diagram usually vary with both the preparer and time. It may initially consist of a simple freehand block diagram with limited information on the equipment; later versions may include line drawings with pertinent process data such as overall and componential flow rates, utility and energy requirements, environmental equipment, and instrumentation. During the later stages of a project, the process flow diagram will be a highly detailed P&I (piping and instrumentation) diagram. For information on P&I diagrams, the reader is referred to the literature (Theodore 2014).
In a sense, process flow diagrams are the international language of the engineer, particularly the practicing engineer. Chemical engineers conceptually view a plant as consisting of a series of interrelated building blocks that are defined as units or unit operations (Abulencia and Theodore 2007; Theodore 2011; Theodore and Ricci 2010). A plant ties together the various pieces of equipment that make up the process. Process flow diagrams follow the successive steps of a process by indicating where the pieces of equipment are located, and the material streams entering and leaving each unit (Felder and Rousseau 1986; Green and Perry 2008; McCabe et al. 1993).
Before attempting to calculate the material or energy requirements of a process, it is desirable to attain a clear picture of the process. The best way to do this is to draw the aforementioned process flow diagram, i.e. a line diagram showing the successive steps of a process. As mentioned, flow diagrams are very important for saving time and eliminating mistakes. The beginner should learn how to draw them properly and cultivate the habit of sketching them at the slightest excuse. Dupont et al. (2016) provide details.
In many cases, simplified flow diagrams are prepared to illustrate the process. These are often for a special purpose and do not show all the details of the process. A common type of process flow diagram shows the major unit operations and chemical reactors with their interconnecting piping and an identification of the materials being processed. The units are not shown to scale, but the drawing may resemble the equipment used for the operation. Such a diagram would be called a graphic process flow diagram. For a small process of a few units, a pictorial process flow diagram with drawings of equipment approximately to scale may be used. Photographs are usually unsatisfactory because the arrangement and connections are seldom clear. Equipment is arranged logically on a process flow diagram to show the flow of materials through the process, but a photograph shows the final physical arrangement determined by structural requirements, without regard to the process flow. When being constructed, all tall absorber columns may be grouped together for structural support, and large heat exchangers may be grouped together for ease of maintenance. The successful individual must learn to read process flow diagrams and relate them to the actual plant layout.
If sufficient data are available, a quantitative process flow diagram may be prepared showing the flow rates, compositions, temperatures, and pressures throughout the process. Such flow sheets may be very complicated. Flow sheets showing instrumentation and controls are also occasionally prepared.
3.7 Significant Figures and Approximate Numbers
Significant figures provide an indication of the precision with which a quantity is measured or known. The last digit represents, in a qualitative sense, some degree of uncertainty or error. For example, a measurement of 8.32 inches implies that the actual quantity is somewhere between 8.315 and 8.325 inches. This applies to calculated and measured quantities; quantities that are known exactly (e.g. pure integers) have an infinite number of significant figures. Note, however, that there is an upper limit to the accuracy with which physical measurements can be made.
The significant digits of a number are the digits from the first nonzero digit on the left to either (a) the last digit (whether it is nonzero or zero) on the right if there is a decimal point, or (b) the last nonzero digit of the number if there is no decimal point. For example:
| 370 | has 2 significant figures |
| 370. | has 3 significant figures |
| 370.0 | has 4 significant figures |
| 28,070 | has 4 significant figures |
| 0.037 | has 2 significant figures |
| 0.0370 | has 3 significant figures |
| 0.02807 | has 4 significant figures |
Whenever quantities are combined by multiplication and/or division, the number of significant figures in the result should equal the lowest number of significant figures of any of the quantities. In long calculations, the final result should be rounded off to the correct number of significant figures. When quantities are combined by addition and/or subtraction, the final result cannot be more precise than any of the quantities added or subtracted. Therefore, the position (relative to the decimal point) of the last significant digit in the number that has the lowest degree of precision is the position of the last permissible significant digit in the result. For example, the sum of 3702., 370, 0.037, 4, and 37 should be reported as 4110 (without a decimal). The least precise of the five numbers is 370, which has its last significant digit in the tens position. The answer should also have its last significant digit in the tens position.
Unfortunately, engineers and scientists rarely concern themselves with significant figures in their calculations. However, it is recommended that the reader attempt to follow the calculation procedure set forth in this section.
In the process of performing engineering calculations, very large and very small numbers are often encountered. A convenient way to represent these numbers is to use scientific notation. Generally, a number represented in scientific notation is the product of a number (< 10 but > or = 1) and 10 raised to an integer power. For example,

and

A positive feature of using scientific notation is that only the significant figures need to appear in the number.
When approximate numbers are added or subtracted, the results should also be represented in terms of the least precise number. Since this is a relatively simple rule to master, note that the answer follows the aforementioned rule of precision. Therefore,

These numbers have two, one, and three decimal places, respectively. The least precise number (least number of decimal places) is 2.8, a value carried only to the tenths position. Therefore, the answer must be calculated to the tenths position only. Thus, the correct answer is 4.7 L (the last 6 and 7 are dropped from the full answer 4.667, and the result is rounded up to provide 4.7 L).
Читать дальшеИнтервал:
Закладка:
Похожие книги на «Introduction to Desalination»
Представляем Вашему вниманию похожие книги на «Introduction to Desalination» списком для выбора. Мы отобрали схожую по названию и смыслу литературу в надежде предоставить читателям больше вариантов отыскать новые, интересные, ещё непрочитанные произведения.


Обсуждение, отзывы о книге «Introduction to Desalination» и просто собственные мнения читателей. Оставьте ваши комментарии, напишите, что Вы думаете о произведении, его смысле или главных героях. Укажите что конкретно понравилось, а что нет, и почему Вы так считаете.