Ted Kwartler - Sports Analytics in Practice with R
Здесь есть возможность читать онлайн «Ted Kwartler - Sports Analytics in Practice with R» — ознакомительный отрывок электронной книги совершенно бесплатно, а после прочтения отрывка купить полную версию. В некоторых случаях можно слушать аудио, скачать через торрент в формате fb2 и присутствует краткое содержание. Жанр: unrecognised, на английском языке. Описание произведения, (предисловие) а так же отзывы посетителей доступны на портале библиотеки ЛибКат.
- Название:Sports Analytics in Practice with R
- Автор:
- Жанр:
- Год:неизвестен
- ISBN:нет данных
- Рейтинг книги:4 / 5. Голосов: 1
-
Избранное:Добавить в избранное
- Отзывы:
-
Ваша оценка:
Sports Analytics in Practice with R: краткое содержание, описание и аннотация
Предлагаем к чтению аннотацию, описание, краткое содержание или предисловие (зависит от того, что написал сам автор книги «Sports Analytics in Practice with R»). Если вы не нашли необходимую информацию о книге — напишите в комментариях, мы постараемся отыскать её.
A practical guide for those looking to employ the latest and leading analytical software in sport Sports Analytics in Practice with R
Sports Analytics in Practice with R
Sports Analytics in Practice with R
Sports Analytics in Practice with R — читать онлайн ознакомительный отрывок
Ниже представлен текст книги, разбитый по страницам. Система сохранения места последней прочитанной страницы, позволяет с удобством читать онлайн бесплатно книгу «Sports Analytics in Practice with R», без необходимости каждый раз заново искать на чём Вы остановились. Поставьте закладку, и сможете в любой момент перейти на страницу, на которой закончили чтение.
Интервал:
Закладка:
1 Introduction to R
Objectives
Learn about R as a programming language
Define Integrated Development Environment
Define objects
Learn the assignment operator
Define functions
Executing a loop
Learn logical operators
Learn about R data types
Learn about object classes
Indexing data objects
Extending R functionality with packages
Writing a custom function
Create a scatter plot with sports data
Create a heatmap with sports data
R Libraries
ggplot2 ggthemes RCurl tidyr
R Functions
+ plot <- round class as.factor as.character c cbind rbind data.frame as.matrix as.data.frame install.packages library getURL read.csv dim names head tail summary table qplot pivot_longer geom_tile scale_fill_gradient xlab ggtitle theme theme_hc
The R Programming Language
R is an open-source, freely available programming language used throughout this book. R is a powerful and longstanding programming language developed more than 20 years ago. It is a derivative of the “S” programming language for statistics originating in the mid-1990s developed by AT&T and Lucent Technologies. Unlike other programming languages, R is optimized specifically for statistics including but not limited to simulation, machine learning, visualizations, and traditional statistical modeling (linear regression) as well as tests. Due to the open-source nature of R, many developers, academics, and enthusiasts have contributed to its development for their specific needs. As a result, the language is extensible meaning it can be easily used for various purposes. For example, through R markdown, simple websites and presentations can be created. In another use case, R can be used for traditional linear modeling or machine learning and can draw upon various data types for analysis including audio files, digital images, text, numeric, and various other data files and types. Thus, it is widely used and nonspecialized other than to say R is an analysis language. This differs from other languages which specialize in web development like Ruby or python which has extended its functionality to building applications not just analysis.
In this textbook, the R language is applied specifically to sports contexts. Of course, the code in this book can be used to extend your understanding of sports analytics. It may give you insights to a particular sport or analytical aspect within the sport itself such as what statistics should be focused on to win a basketball game. However, learning the code in this book can also help open up a world of analytical capabilities beyond sports. One of the benefits of learning statistics, programming, and various analysis methods with sports data is that the data is widely available and outcomes are known. This means that your analysis, models, and visualizations can be applied, and you can review the outcomes as you expand upon what is covered in this book. This differs from other programming and statistical examples which may resort to boring, synthetic data to illustrate an analytical result. Using sports data is realistic and can be future oriented, making the learning more challenging yet engaging. Modeling the survivors of the Titanic pales in comparison since you cannot change the historical outcome or save future cruise ship mates. Thus, modeling which team will win a match or which player is a good draft pick is a superior learning experience.
If you are new to programming don’t be intimidated. R is a forgiving language in that things like spacing an indentation are ignored. Further, the R community is well supported and a simple online search of any error message usually finds an answer quickly on any number of sites.
To begin your R and sports analytics journey, please download the “base-R” distribution for your operating system. The “Comprehensive R Archive Network,” CRAN, is the home of the official R distribution as well as officially supported packages (more on that in a bit). The site to download base-R is https://cran.r-project.org.
Unfortunately, base-R, having started in the nineties, looks abysmal and lacks some modern day functionality. Thus, you will need to next download the R-Studio Integrated Development Environment, or IDE. An IDE is software that consolidates many of the aspects needed to code into one place. For example, you will need to write code which could be done in a simple notepad like program, a place to execute the code written, a place to visualize plots that were output from the code, and so on. These individual components are assembled into the IDE for ease of use and fast development. R and many other languages have IDEs. In fact, R has multiple IDE optimized for the type of analysis you are performing such as biostatistics or working with another language like Java. The most popular and easily supported IDE for base-R is the R-Studio software. There are server and desktop versions available. The code executed in this book should work for either cloud or local but installation of base-R and R-Studio on a server is not covered. Therefore, please download the R-Studio desktop IDE by navigating to https://www.rstudio.com/products/rstudio.
The R-Studio IDE, or Integrated Development Environment, adds functionality and modern user interface to base-R. The IDE aggregates common functionality used for software development and statistical analysis.
Essentially R-Studio sits on top of base-R. The IDE provides a modern GUI expected of today’s computer users while also adding functionality including the use of version control, terminal access and perhaps most importantly an easy way to create and view visualizations for easy export and saving to disk. Figure 1.1 illustrates the basic relationship for base-R and R-Studio. As you can see without base-R, the IDE will not function because none of the computational functions exist in the IDE itself.
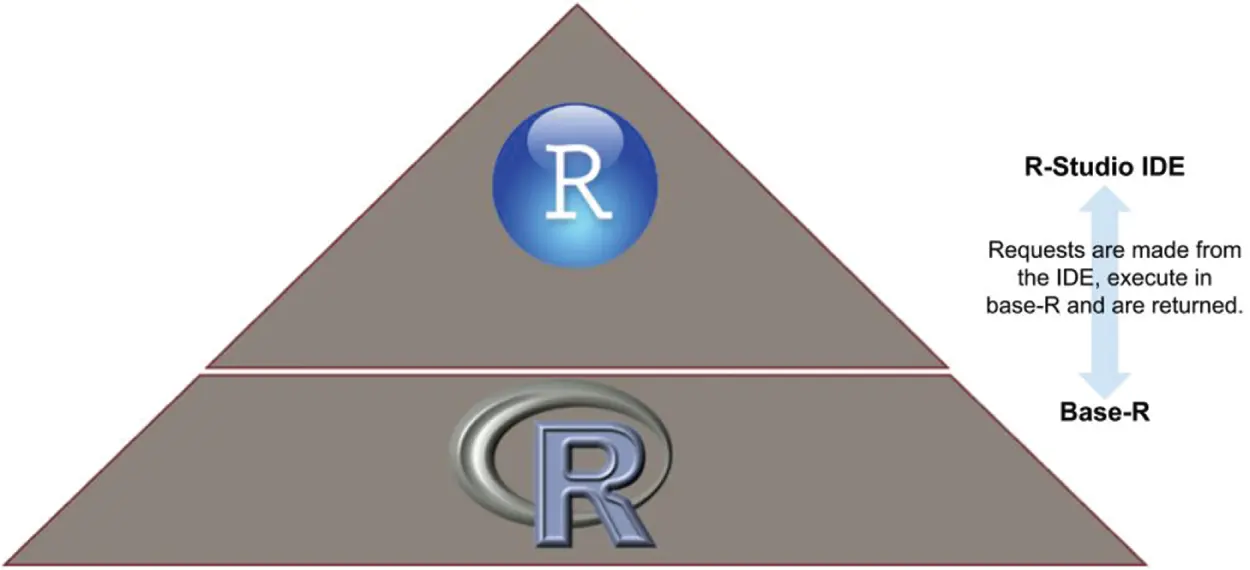
Figure 1.1The relationship between base-R and R-studio.
Now that you have both base-R and R-Studio, let’s start to explore the programming environment. Think of an R environment as a relatively generic statistical piece of software. Once downloaded it can perform all tasks programmatically found in many of the popular spread sheet programs either online or for a laptop. The advantage of R is its extensibility mentioned earlier. R can be specialized from a generic statistical set of tools into a more interesting and nuanced piece of software. This is done through the download of specialized packages and called in the console by loading the package for the task at hand.
Figure 1.2 shows the IDE itself without a “script” to be executed. For now, focus on the “console” section in Figure 1.2. This is the lower left-hand side containing a “>” symbol. This is the section where code will be executed and results are returned.
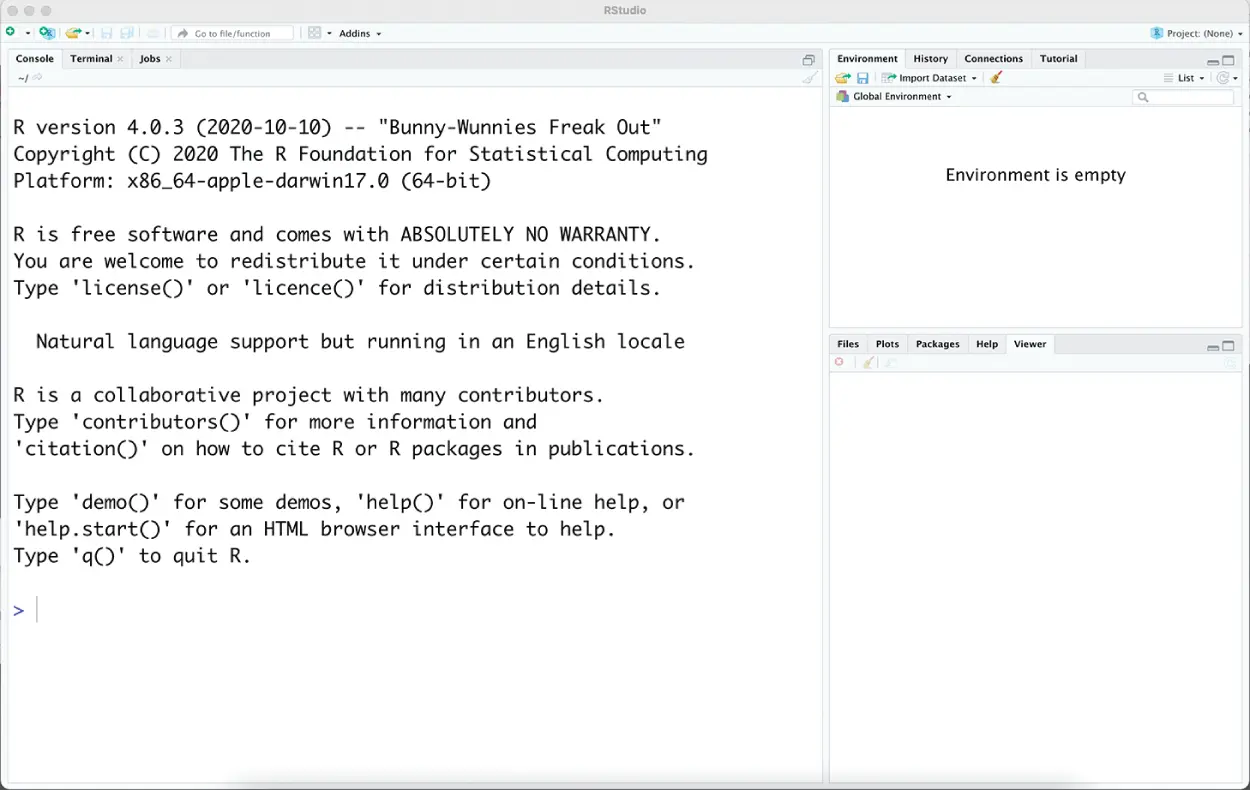
Figure 1.2 The R-Studio IDE console.
The next step is to navigate to “File > New File > R Script” in the upper left of the IDE. This will open another pane in the IDE. The script pane will be located in the upper left section of the IDE and will shrink the console on the lower left-hand side. While the console is where code is executed and computation enacted, the scripting section is where you will write code that is then run within the console. Think of an R script as merely a lightweight text file that can be saved and repeated by running in the console. A script is nothing more than a set of instructions that have not been enacted yet. To save an R script, navigate to “File > Save” and then simply follow the IDE dialog. The rest of the book provides R scripts for you to execute along with explanations along the way. Figure 1.3 shows the new script pane with some basic example code.
Читать дальшеИнтервал:
Закладка:
Похожие книги на «Sports Analytics in Practice with R»
Представляем Вашему вниманию похожие книги на «Sports Analytics in Practice with R» списком для выбора. Мы отобрали схожую по названию и смыслу литературу в надежде предоставить читателям больше вариантов отыскать новые, интересные, ещё непрочитанные произведения.


Обсуждение, отзывы о книге «Sports Analytics in Practice with R» и просто собственные мнения читателей. Оставьте ваши комментарии, напишите, что Вы думаете о произведении, его смысле или главных героях. Укажите что конкретно понравилось, а что нет, и почему Вы так считаете.